Food Inflation vs Inflation, 2019-2025
Canada’s official inflation rate is released by Statistics Canada once a month. July’s data show that, on average, prices increased by 1.7% in Canada between July 2024 and July 2025. Policy makers will be celebrating that number as many (here, here, here and here) were worried that this trade war could lead to higher inflation.
July’s inflation rate falls securely inside the Bank of Canada’s inflation target of 1%-3%. But even at this low, in-line rate, it’s still important to examine the underlying data for a more complete picture of Canada’s rising prices.
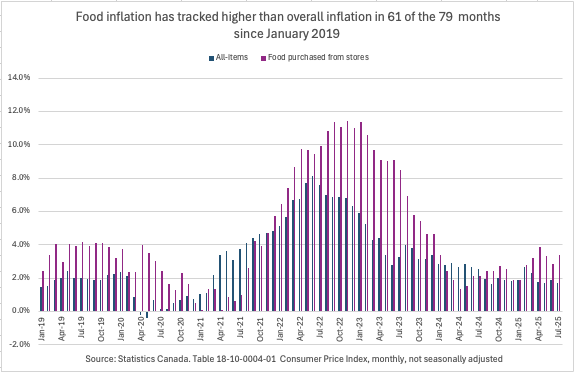
Overall inflation may have been 1.7% but grocery prices increased by 3.4% – fully double the overall inflation rate. So even if inflation seems low in aggregate, the fact that essentials like groceries are rising faster than the average means households are likely feeling a little more squeezed than the headline number suggests.
That’s why peoples’ experience of Canada’s cost of living doesn’t always match the official inflation figure, because it depends heavily on what categories they spend the most on in their day-to-day lives.
Read more analysis by Kaylie here.


Subscribe to