SHIELD Charts
Household Net Savings

Canada’s affordability crisis has continued to escalate. Canada’s growing savings gap is another indicator that highlights how unevenly the benefits of the current economy are being shared across income groups. High-income households are able to save and invest, building financial security while lower income families are forced to borrow to cover the basics.
Merchandise Exports

Prime Minister Mark Carney is aiming to double non-US exports in the coming years. So far, it seems he is having some success with exports to the rest of the world up by 15.5% by September and US exports down almost 6%. Whether the shift is sustainable or a one time lift from trade in precious metals remains to be seen but this is a trend to watch in 2026.
Canada's Productivity Performance: Not As Bad As We Thought?

This chart shows a notable revision in Canada’s productivity trend. While earlier data suggested stagnation with declines in most quarters, the revised Statistics Canada numbers show productivity rising in six of the last eight quarters, indicating the economy may be on an upward trajectory after COVID-related disruptions.
The TSX is soaring while the labour market waits: what that really says about Canada’s economy
%20(1700%20x%20890%20px)%20(1900.png/:/cr=t:0%25,l:0%25,w:100%25,h:100%25/rs=w:388,cg:true)
This chart shows a sharp divergence between the TSX Composite Index and Canada’s job vacancy rate. While the stock market has surged, job vacancies have steadily fallen, highlighting the emergence of a two-speed economy.
Components of GDP - % Change Q2 2025
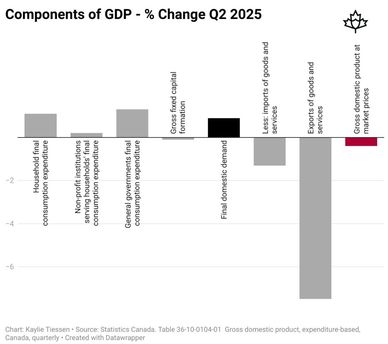
This chart highlights how the exports of goods and services have dipped noticeably in Q2 of 2025. Imports have also declined during this period.
Fewer jobs, fewer hours, less pay.
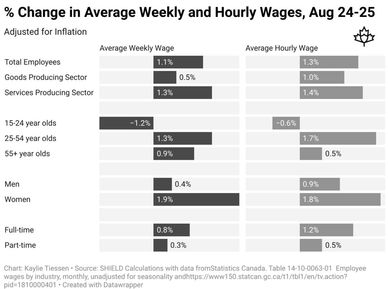
This chart shows that the growth in wages varies by age group and employment type, with the younger workers facing steeper declines in average weekly wages and average hourly wages between August 2024 and 2025. It also highlights how every other age group has managed to rise, forcing one to question what is happening with youth employment.
Labour productivity fell in Q2 as firms held onto workers

This chart showcases how productivity in certain sectors has remained stagnant since 2023. With all sectors being drastically affected in 2020 due to COVID-19.
Change in monthly merchandise exports into 2025

This chart illustrates how there has been a sharp decline in Canada's total change in merchandise exports, so far in 2025. It is a staggering decrease of $8.3 billion since the beginning of the year.
Counter-Tariffs are Impacting your Shopping Cart: Will their removal bring relief?

This chart highlights how counter-tariffs have caused the prices of several items, such as bacon and beef, to surge drastically between August 2024 and 2025. Gasoline was the only good listed that decreased during this time.
Digitally Delivered Services are a Fast Growing Export Opportunity - Why did they stall?

The graph shows that Canada's digital service exports surged between 2019 to 2021. However, it has since remained stagnant and regressed slightly.
Canada's evolving economy by region

This vast comparison chart highlights how employment and unemployment growth vary across the nation. The visual shows how unemployment has risen in every region, with every area sitting above 4% and most sitting above 6%.
R&D spending in Canada is dominated by foreign firms. We can fix that.

This chart showcases how foreign firms operating in Canada spend 8 times more on R&D on a per firm basis than Canadian-owned firms. This example clearly illustrates what is at stake when R&D in Canada is dominated by foreign firms.
Household Savings Rate

Canadians are saving a larger share of our income than we were in the 5 years before the pandemic - a surprising outcome considering the uncertainty we all experienced in 2025 (or maybe it's a prudent response to all the uncertainty?).
Foreign Controlled Assets

Ownership shapes who makes business decisions and who captures that value of Canada’s economic activity. Canada has some of the highest levels of foreign ownership and control in the G-7. Foreign control in Canada has steadily declined over the last 15 years. The Carney government is trying to drive more private investment in Canada’s critical infrastructure, and we should expect foreign ownership to tick up as Ottawa chases investment from multiple sources.
Affordability concerns continue to mount and new Statistics Canada data show those worries are well

Canada's affordability crisis continues to pose mounting pressure on Canadians' finances. In poll after poll, food and shelter costs continue to top the list of economic concerns of Canadians. It's no wonder... The cost of groceries and rent have increased 30% since 2021 but the average wage has only increased 20%. That means the price of essentials is growing 50% faster than our average hourly pay.
Canada vs. Foreign Control of Business Assets

Prime Minister Mark Carney has made no bones about it: he is courting foreign capital to catalyze investment in Canada’s economy — including in nation building projects. Will that capital lead to increased foreign control of our economy? Currently, the most trade-exposed industries — including manufacturing, oil & gas and mining — seem to have the highest share of foreign controlled assets. Will the government impose foreign ownership limits or other controls to ensure Canada retains sovereign governance over key assets, or will we give it away?
TSX vx. NASDAQ Performance

Since Trump’s 2025 inauguration, the S&P/TSX composite index has outperformed the NASDAQ and a wide divergence has emerged since early November. Whether the shift leads to continued outperformance from the TSX is something to watch in 2026.
The Recent Grad Unemployment Gap

The economy performed better than expected in 2025, but it did not deliver for many new graduates.The chart below shows that the grad gap has grown – that is, the gap between the unemployment rate for university grads aged 15-24 and the unemployment rate for the overall economy. In 2025, the unemployment rate for new graduates was 4 percentage points higher than the overall population. The highest on record outside of the pandemic.
Growth rate of Permanent vs. Temporary Employment in Canada

Measuring the quality of the labour market requires more than one chart, but one is what you are getting today. The chart below shows that total employment (not including self-employed individuals) grew by 1.75% between November 2024 and November 2025 but temporary employment sky-rocketed while permanent employment increased by just 0.2%. Employers may be hiring, but those new jobs are precarious because they are not permanent.
The Share of Businesses Planning to Shrink the Size of their Workforce Doubled in 2025

Canadian businesses are less pessimistic about their future prospects than they were last summer but overall, the outlook is still subdued. And some indicators are showing alarming trends. For example, the share of firms planning to reduce the size of their workforce more than doubled between Q2 and Q4 of 2025. Businesses are feeling the uncertainty of the trade war.
Canadian Population and Federal Public Service Employees to Population Ratio
Canadian Population and Federal Public Service Employees to Population Ratio

The federal government has issued more than 15,000 layoff notices as part of a plan to cut the public service by nearly 5%, even as it calls for a major strategic pivot in trade, procurement, and economic governance. Key departments like Global Affairs, PSPC, and Statistics Canada are losing capacity at the very moment Canada needs careful negotiation, smarter procurement, and better data. The concern is that rebuilding economic sovereignty will require more public-sector capability, not less.