Persistent Over-Qualification in Canada
This research project was generously funded by the Future Skills Centre and the Government of Canada
The Future Skills Centre (FSC) is a forward-thinking centre for research and collaboration dedicated to preparing Canadians for employment success. It was founded by a consortium whose members are Toronto Metropolitan University, Blueprint ADE, and Signal49 Research, and is funded by the Government of Canada’s Future Skills Program.
The opinions and interpretations in this publication are those of the authors and do not necessarily reflect those of the Government of Canada.
Executive Summary
Canadian skills policy is built almost entirely on the supply side: Ottawa spends roughly $3 billion a year on Labour Market and Workforce Development Agreements, and Prime Minister Mark Carney has promised a further $6 billion over five years for the trades, premised on workers lacking the skills that employers want.
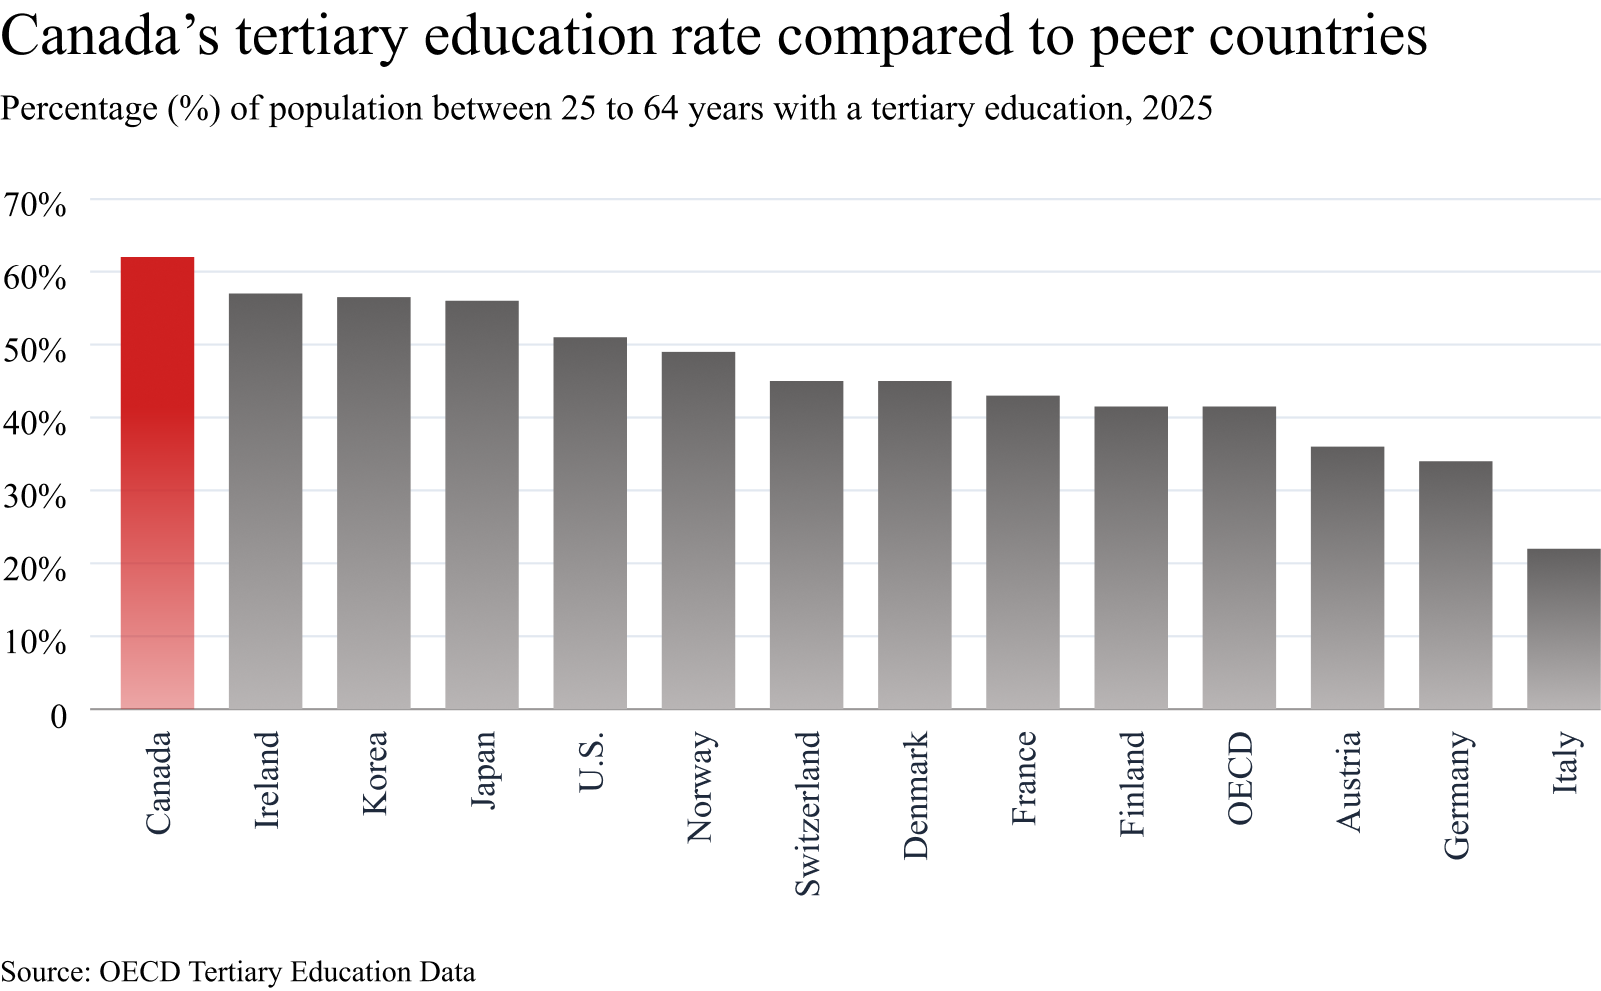
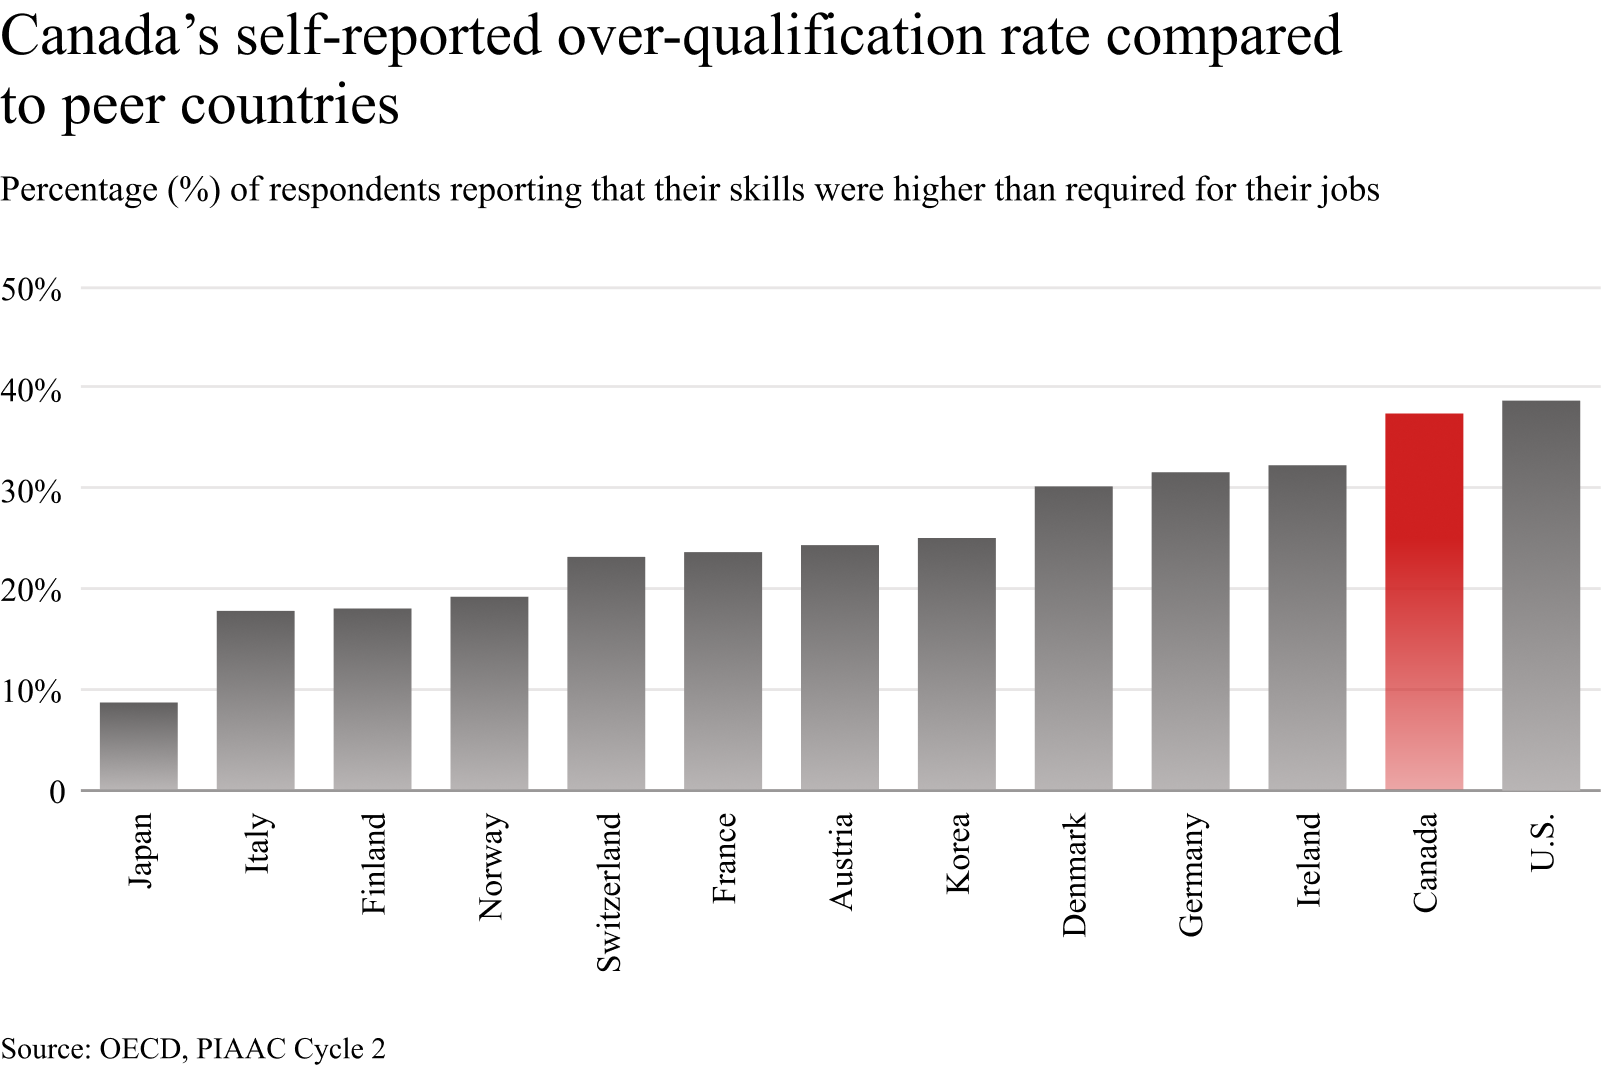
At the same time, Canada is the most educated country in the Organisation for Economic Co-operation and Development (OECD), with 63% of Canadians aged 25 to 64 holding tertiary education. Canada also has the second-highest rate of self-reported over-qualification, with 37.3% of workers saying their job does not fully utilize their existing skills. Canada’s over-qualification rate has been consistently identified by the OECD as a key driver of productivity shortfalls compared to peer countries.
This paper asks who those workers are, and whether existing skills training policy is appropriate for an economy undergoing structural shifts in labour demand.
We rely on a self-reported measure of over-qualification constructed based off of a question in the Programme for the International Assessment of Adult Competencies (PIAAC), which asks workers to describe their skills in relation to the requirements of their current job.
The self-reported over-qualification rate fills a gap no existing measure covers. Over-qualification is almost always calculated by comparing a worker’s credentials to the listed credentials that their job requires. On that basis, the OECD puts Canadian over-qualification at 28%. Workers themselves report 37.3%, nearly ten percentage points higher. The gap exists because Question H2-Q19a of PIAAC asks about skills rather than diplomas. The self-assessment captures capability built through experience and unaccredited learning.
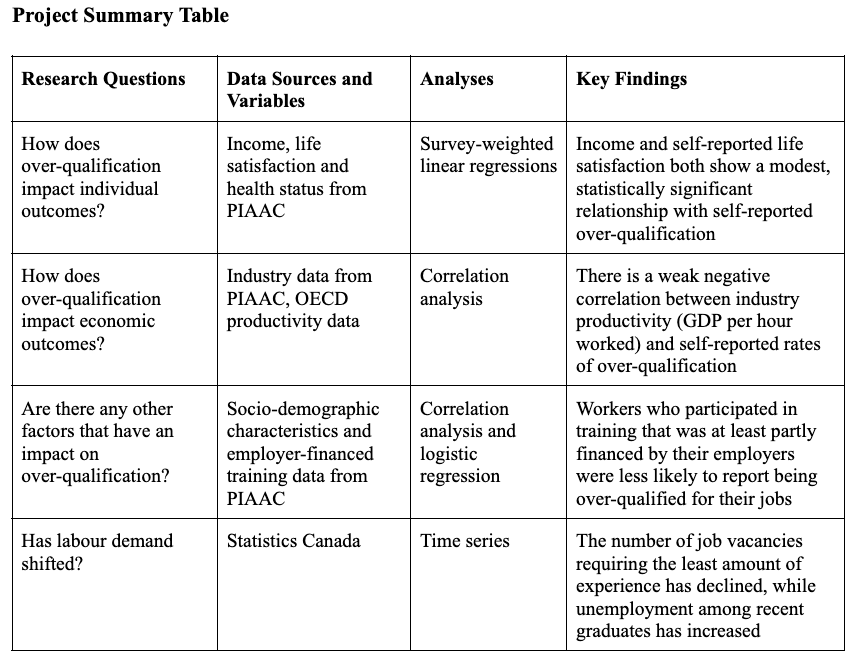
We use simple correlation analysis and survey-weighted linear regressions or logistic regressions to test the relationship between self-reported over-qualification and a number of individual and economic factors (see the Project Summary table below for a more comprehensive overview of our methodology).
We find a modest, statistically significant negative relationship between self-reported over-qualification and monthly earnings deciles and life satisfaction. The relationship with self-reported health status was statistically insignificant.
As far as economy-wide factors, we observe a weak negative correlation between over-qualification and industry-level productivity. Further study is needed to corroborate this finding.
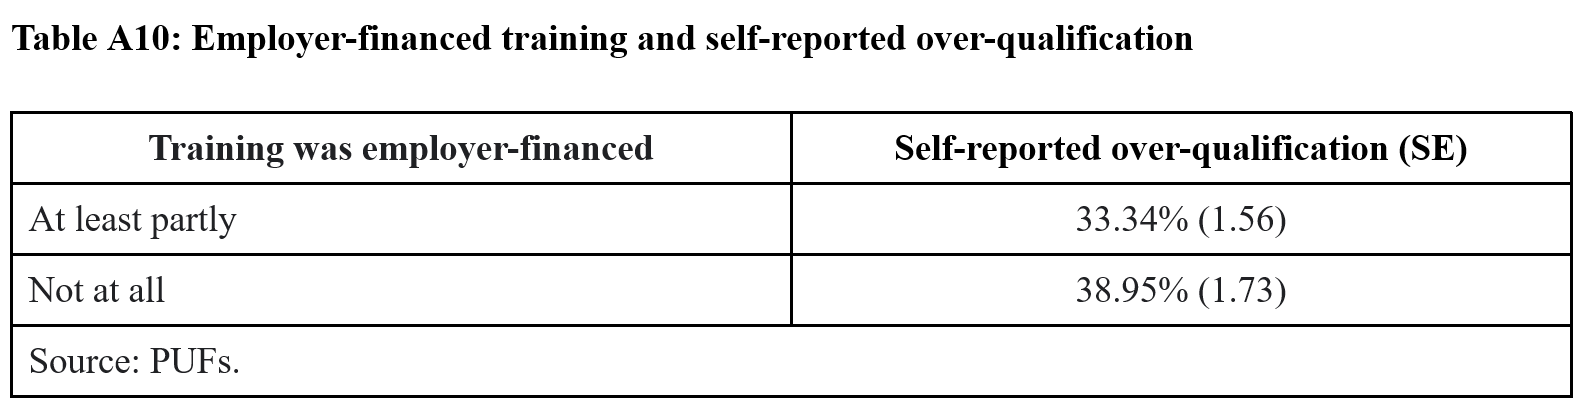
In examining the key drivers of perceived over-qualification, we also identify skills training as a key differentiator. Workers are meaningfully less likely to say that their skills are higher than their current job requires if they have received employer-funded training in the past year: 33% of workers who received employer-financed training report being over-qualified for their jobs, compared to 39% of those who received training that was not. Workers who exclusively participated in training during their paid work hours were also less likely to report being over-qualified for their jobs, at 33%, compared to workers who completed training outside of their paid working hours, at 38%.
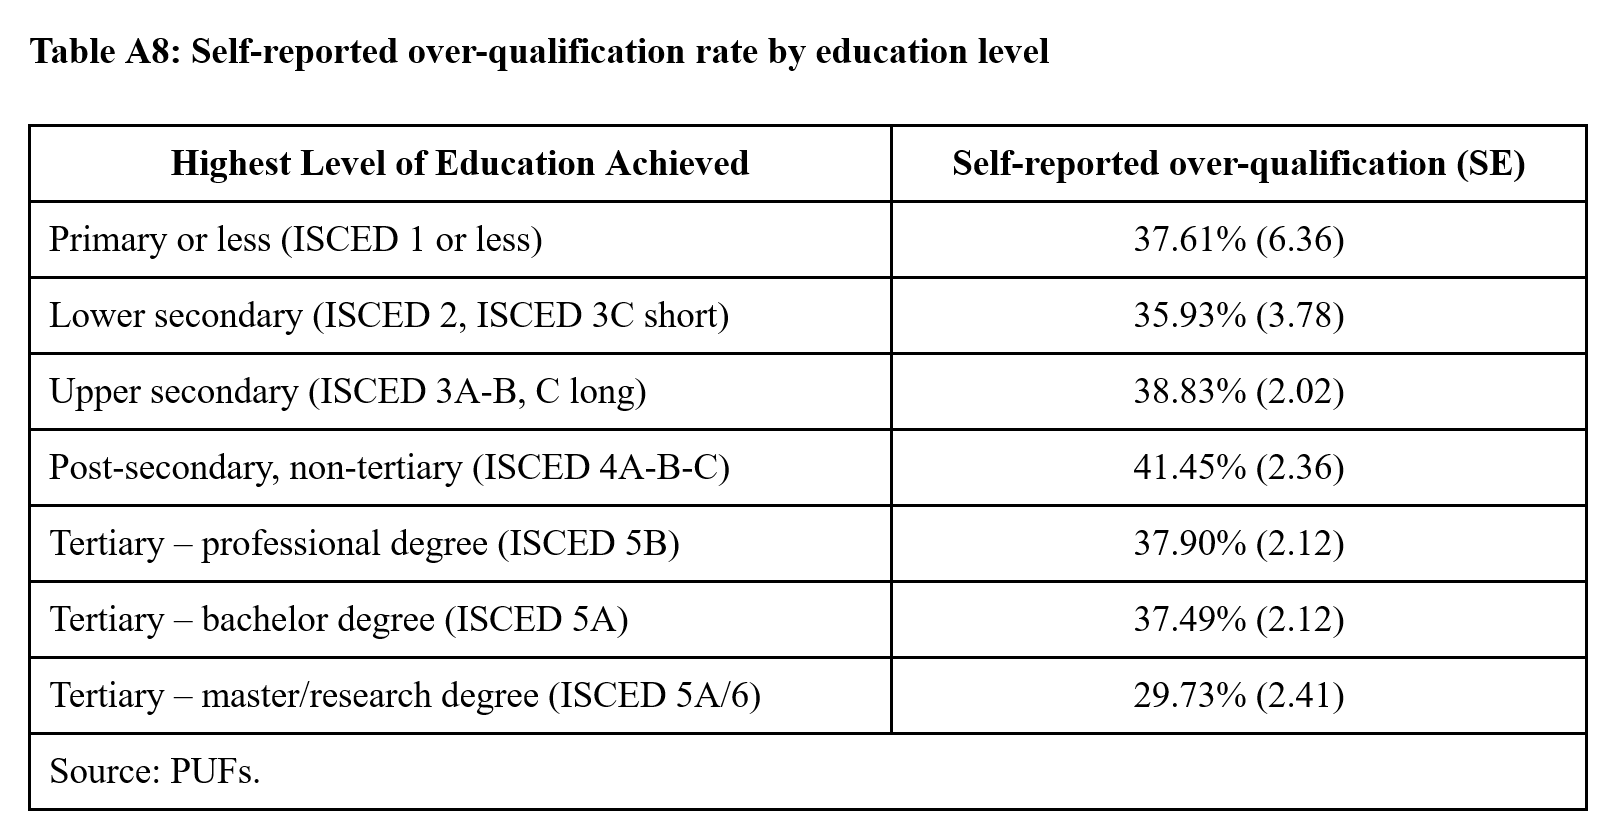
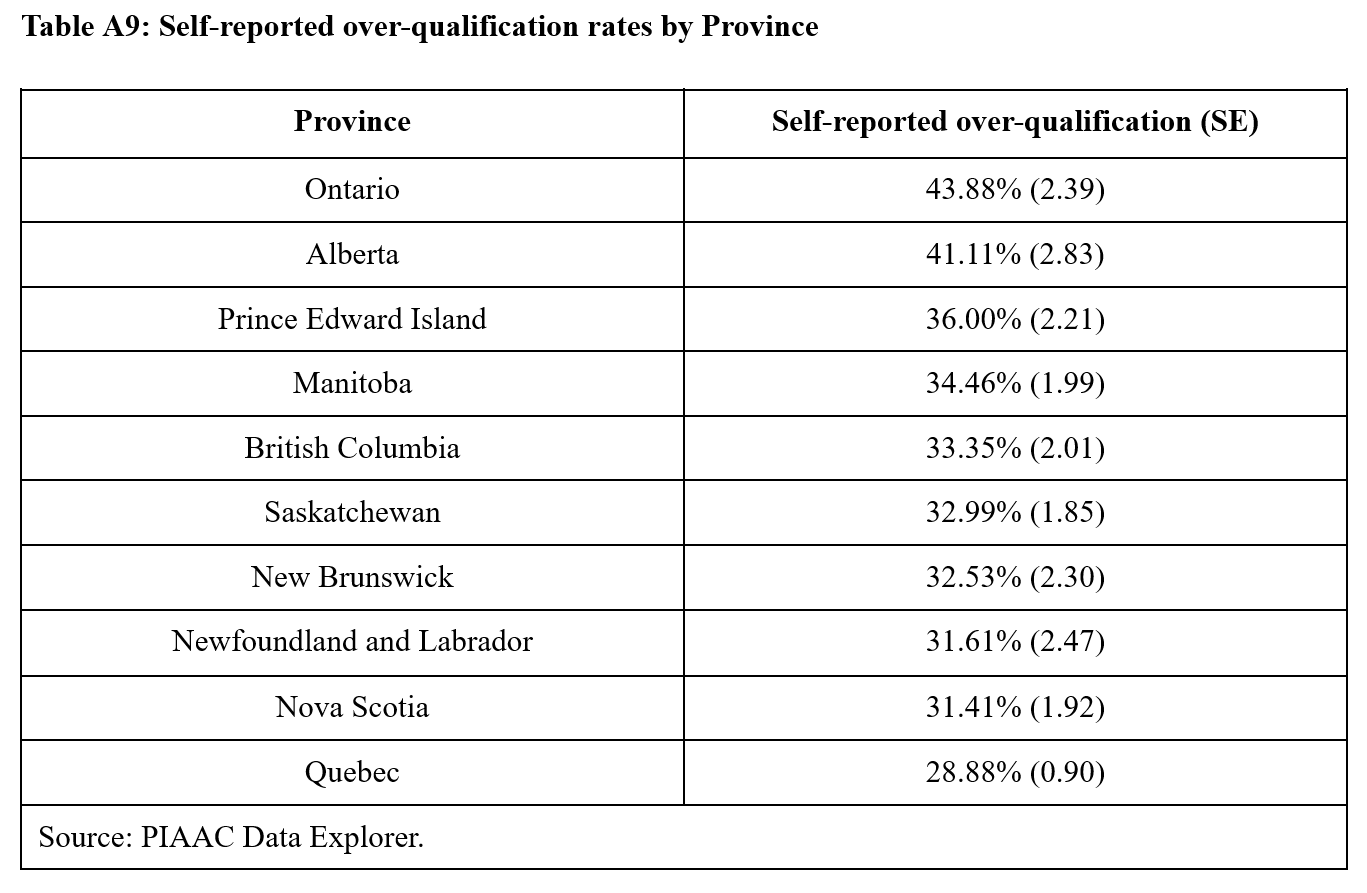
From our analysis of demographic patterns, we observe a significant gender gap in self-reported over-qualification. 42.25% of men reported being over-qualified for their jobs, compared to 31.92% of women. The rates of self-reported over-qualification between Canadian-born and foreign-born workers were virtually identical (37.2% compared to 37.7%). Looking at educational attainment, we found the highest rates of self-reported over-qualification among workers possessing a trades certificate or other post-secondary non-tertiary education (41.5%) and the lowest among workers with the most advanced degrees (29.7%). We also noted substantial variation in over-qualification across provinces, from 43.88% in Ontario and 41.11% in Alberta to 28.88% in Quebec.
We set forth three policy directions:
- Federal and provincial governments should re-examine their skills development policies and consider ways to incentivize firms to provide employer-paid training programs. Employer-financed training was associated with lower levels of self-reported over-qualification, which could suggest that it reflects better pathways from skill development to skill use for workers.
- Statistics Canada should conduct a comprehensive survey of skills utilization and matches in Canada.
- Ultimately, further research is needed to assess many of the patterns we observe, including the differences in over-qualification among provinces and between Canada and other jurisdictions, the relationship between over-qualification and individual or economic outcomes, as well as the influence of demand-side factors.
Because we rely on self-reported data, which has inherent shortcomings, our findings do have some limitations. In our examination of demographic breakdowns, some patterns of self-reported over-qualification are likely better explained by social factors and inflated self-regard, rather than objective reality. The PIAAC survey data also does not capture the magnitude of a worker’s perceived over-qualification.
However, self-assessed over-qualification is an important complement to existing measures, because belief is powerful. Belief is what drives quitting, emigrating and the decision to pursue or forgo further training.
Introduction
Canada is one of the most educated countries on earth. As of 2025, 64% of Canadians aged 25 to 64 have completed some form of tertiary education—the highest share among all OECD countries. We tend to treat that education number as an unambiguous win: proof of a well-educated, future-ready workforce. And in many respects, it is.
However, Canada also has the second-highest self-reported over-qualification rate among peers, at 37.3%.
A highly-educated population is not the same thing as a workforce that is qualified for the available jobs in today’s economy. The high level of educational attainment has not been matched by growth in jobs requiring the credentials that Canadians have earned. Instead, we see graduates who struggle to find work that suits the skills they have developed.
Canada’s debate around skills tends to focus on supply-side interventions that consistently push workers to get more training, more microcredentials and more education so they can stay current and fit the jobs in today’s economy.
The federal government alone already spends about $3 billion a year on Labour Market Development and Workforce Development Agreements with the provinces. These agreements inject federal cash into provincial worker training systems designed to help unemployed workers train for the skills they need to get a new job. Prime Minister Mark Carney has promised an additional $6 billion over five years to help more people get employment in the trades.
Skills shortages tend to be clustered in certain sectors and occupations. As of 2025, Employment and Social Development Canada (ESDC) identified that 103 occupations are at moderate to strong risk of shortage through 2033. Of the occupations that ESDC tracks, 21% are rated as moderate or strong risk of skills shortage between now and 2033; more than half of those occupations are related to health and construction. This is clearly not an issue that is simply rooted in the new economy and high-tech transformation.
Today, our policies are geared towards helping workers acquire skills and credentials in the hope of qualifying for existing jobs. For example, the Government of Canada’s Job Bank has a page identifying which industries and jobs are trending in order to help workers “make education and training choices.”
But what if our focus on supply-side labour market interventions neglects fundamental shifts in the demand for labour? This is something bigger than an individual- or firm-level failure. Being unemployed in one’s field does not necessarily mean that a worker is unskilled; it might mean that the demand for those skills has changed.
One potential way that structural shifts in demand could show up in the data is in workers feeling that their existing skills are under-utilized, even as businesses report skills shortages. This feeling is an essential symptom worth diagnosing, as a worker’s perception of how their skills are used in the labour market is ultimately what will factor into their decision to quit a job, to emigrate, or to pursue training.
We analyzed the most recent (2022/2023) cycle of the OECD’s Survey of Adult Skills (PIAAC) and found that 37.3% of Canadian workers report being over-qualified for their current position, higher than all peer nations except the United States, which has a comparable rate of over-qualification. Indeed, the OECD has consistently identified over-qualification as a challenge in Canada’s labour market. One worker developing skills and expertise that are not valued by the labour market is a matter of individual choice. A pervasive mismatch between skills and labour market demands is a policy problem. If Canadian workers are being educated to a high level but the labour market is not able to use the skills that Canadians have developed, our public education spending is proving to be a poor investment. The trade war with the United States has elevated the importance of leveraging all of Canada’s resources to reduce dependency and build economic resilience, including our highly skilled and educated workforce.
This is an underexplored corner of Canada’s labour market conversation. Our aim is to provide foundational context for a more nuanced discussion about skills: one that moves beyond the supply-side of the conversation towards recognizing demand-side constraints and shifts.
This paper explores Canada’s self-reported over-qualification rate to better understand who believes they are over-qualified, where they work and whether over-qualification could be affecting overall productivity.
Literature Review and Context
Canada’s over-qualification challenges are not new.
Historical data shows that skills mismatches have been a persistent issue for Canada for decades. A survey from 1994 showed that over 40% of the employed Ontario workforce had other skills they would have liked to use in their job, and 40% of respondents thought that people generally had more education than the jobs required.
Skills mismatches, including over-qualification, are often thought to have an impact on job satisfaction, but the evidence is mixed. A study of 2012 Cycle 1 PIAAC survey data found that under-skilled and under-educated Indigenous workers were more likely to be satisfied with their jobs than their-well matched counterparts. Job satisfaction for over-educated Indigenous workers was much lower. Another study, using a different methodology, found that there was no association between skill mismatch and job satisfaction, concluding that job satisfaction is instead driven primarily by skill use.
Beyond individual impacts, higher rates of skill and qualification mismatch show an association with lower labour productivity. The OECD has consistently identified over-qualification as a challenge in Canada’s labour market and estimates that 15% of the productivity gap between Canada and the top 3 countries with the lowest rates of skills mismatch can be explained by labour market mismatch. The Conference Board of Canada estimates that skills shortages and mismatches will cost the Canadian economy over $11 billion in lost GDP in 2040.
Meanwhile, Canada is losing university graduates in a phenomenon known as “brain drain”. Researchers at Brock University found in 2018 that graduates of technology-focused Canadian programs flock to the U.S. for more opportunity and the potential for higher pay. Brain drain may also explain some of the Canada/U.S. GDP and labour productivity gap. The top 10% of earners account for a majority of the gap and Canadian-born individuals living in the U.S. are more educated and earn more on average than individuals born in the U.S. Statistics Canada emigration data more broadly suggests that highly-educated workers are the most likely to leave Canada—a problem that is especially pronounced for highly-educated immigrants.
There is a growing body of evidence exploring how skills utilization can be shaped through firm behaviour. The way that firms design jobs, incentivize employees, and utilize technology can determine how workers are able to deploy their skills. A similar study found that the ways a worker’s talent, knowledge and aptitude are identified and measured is often poorly designed, resulting in poor metrics for measuring aptitude and lower skills utilization. This implies that better measures could lead to better outcomes.
Studies from Nigeria, Sweden and Germany all find that talent management practices such as aptitude testing and skills mapping can enhance firm development over time, but the process of learning talent management is complicated. There are a number of Canadian companies developing tools to measure the aptitudes and capabilities of workers. They believe the tools could be a missing link in closing the skills gap.
Firm-level hiring practices also impact skills utilization. For example, skills-first hiring approaches can allow employers to develop new talent pipelines to reach properly skilled applicants. These approaches depend on competencies that are needed for performance in a specific role, rather than credentials, thus potentially allowing workers who might otherwise be overlooked to be hired in roles that match their skills.
Meanwhile, educational attainment is failing to deliver on the traditional assumption that it will lead to better opportunities. Since the COVID-19 pandemic, the wage premium for holding an advanced university degree, compared to a bachelor’s degree, has fallen, and highly-qualified candidates are competing for a comparatively smaller pool of jobs requiring their qualifications. We see a skepticism of higher education reflected in polling: in 2025, less than half (48%) of Canadians believed that a university or college diploma was worth the investment, with younger Canadians the most skeptical of the potential value.
In theory, our highly skilled and educated workforce can support innovation and economic growth, but in practice, demand has not kept up with the skills and qualifications we are instilling in our workers.
Research Design
This project is designed to see beyond top-line numbers to assess the distribution of over-qualification across demographic groups and industry categories. The goal is to analyze whether over-qualification systematically drives underperformance in individual and economic outcomes such as income, life satisfaction and productivity.
We want to understand if there are certain demographic groups who perceive their skills as being underused and what industries they work in. Further, we conduct some simple correlation estimates as a first look at whether self-reported over-qualification shows a correlation with income, life and job satisfaction or productivity. We use regression analysis to further test select correlations that we identify. And we look at labour force survey data to determine whether the economy is generating jobs that require the qualifications workers have developed.
This project uses the OECD’s Programme for the International Assessment of Adult Competencies (PIAAC) Survey of Adult Skills data. We specifically rely on the self-reported over-qualification as our main measure for this study. We do so because we believe it is an under-examined indicator of labour market dissatisfaction that is worth understanding more clearly.
The PIAAC survey asks a direct question about skills utilization via Question H2 – Q19a, which asks respondents to describe their skills in relation to their job requirements. Respondents are given four options: the skills are higher, match or lower than what is required or the respondent does not know.
Survey respondents are considered to have self-reported as over-qualified if they answer A: My skills are higher than what is required.
The following question in the PIAAC survey (H2-Q19b) does ask respondents which skills they were thinking of when they answered H2-Q19a, but unfortunately this question is only administered to respondents who reported that they were under-qualified. For this reason, we cannot know what skills the workers who reported being over-qualified had in mind.
Due to the nature of the question, survey respondents could be referring to any number of different skills—from those generated in school, during their tenure in a role, in past roles or by taking additional microcredentials. The over-qualification policy debate often fixates on a worker’s level of education as a proxy for skill, but there are other pathways to develop skills and capabilities.
We recognize the inherent bias that comes with using self-reported data. Taken alone, it may be criticized as a flawed metric, and it is indeed an important limitation of our research. Our metric of over-qualification assesses only whether a worker feels that they are over-qualified, rather than whether they are objectively over-qualified based on their formal qualifications or an assessment of their skill level compared to the average required for their jobs.
However, for the purpose of our research question, self-reported data also has a strength: perceived over-qualification is essential to understanding the lived experience of Canada’s workers.
Ultimately, we would argue that all measures of qualification and job skills utilization have their own limitations. An understanding of the labour market can be enhanced by looking at a suite of different metrics, and self-reported over-qualification should be part of that picture.
The PIAAC Cycle 2 Survey was administered in 2022 and 2023 across 31 countries. In Canada, respondents were aged 16-65 living in private households. We splice self-reported over-qualification for several demographic indicators including gender, age, education level and by respondents’ place of birth.
We accessed PIAAC Cycle 2 data from two different repositories: the Public Use Files (PUFs) from OECD and the OECD PIAAC Data Explorer. We used the EdSurvey package for estimation and weighting of PIAAC data.
We conduct peer country comparisons of self-reported over-qualification using PIAAC Cycle 2 data from the OECD PIAAC data explorer.
We assess the relationship between self-reported over-qualification and life satisfaction, job satisfaction and health using simple regressions.
We assess the correlation between self-reported over-qualification and productivity across Canada’s industries using the OECD productivity database and the OECD PIAAC data explorer. Both straight correlations and simple regression analysis are used.
We test the correlation between how worker training is financed and self-reported over-qualification using logistic regression, also looking into whether training is completed during working hours.
Finally, we look briefly at the education requirements of job vacancies and the credentials of unemployed workers to understand if, at a high level, demand for labour has shifted in a way that could impact how skills are utilized.
Findings
Overall, 37.3% of workers in Canada report that their skills are higher than their job requires. The majority of workers — 57.02% — say their skills are well matched and just 5.65% report that some of their skills are lower than required by their job and need to be further developed.
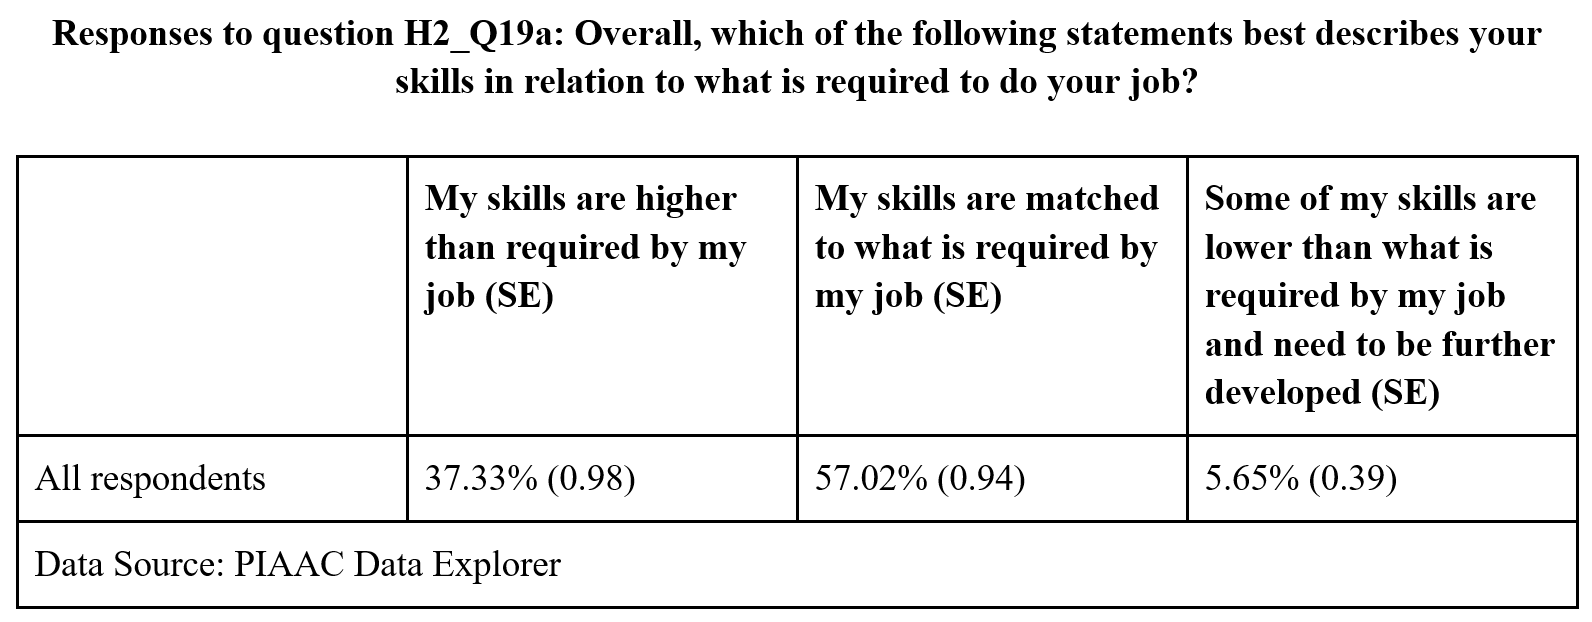
These responses highlight a gap between self-reported experience and measures of over-qualification based on educational requirements alone. The OECD 2023 PIAAC Survey found that 28% of workers in Canada are over-qualified for their job based on educational attainment, which is nearly 10 percentage points lower than what Canadian workers report themselves. The difference could be due to experience in the field, tenure on the job, additional credentials or training, or even inflated self-regard.
Over-qualification has a modest impact on individuals
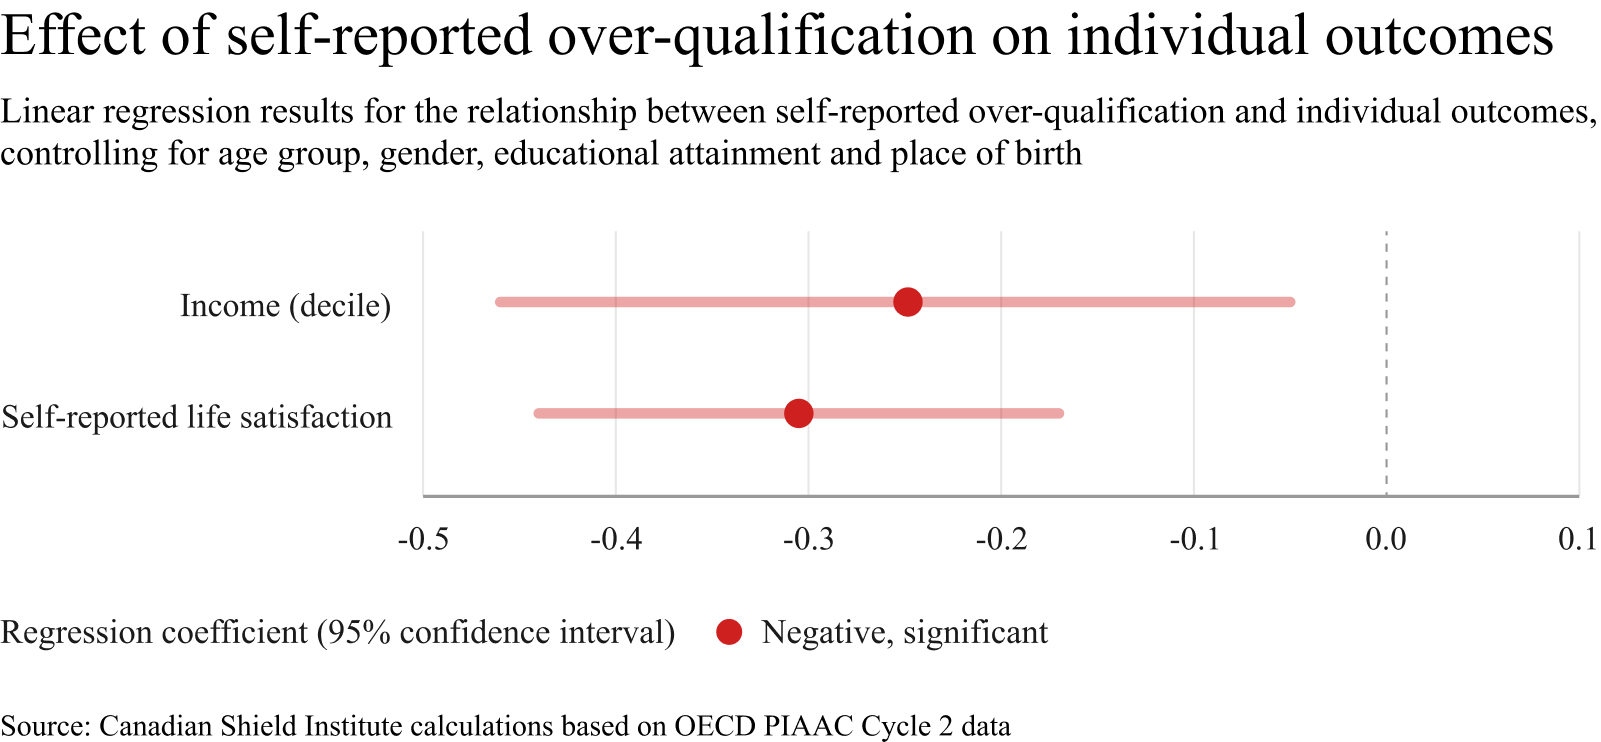
Using regressions, we tested the correlation between self-reported over-qualification and individual outcomes, including income, health and life satisfaction.
For income and life satisfaction, we used survey-weighted linear regressions as they are both numeric discrete variables (Table A1). We observed that over-qualification has a modest negative relationship with these variables.
For self-reported health status, we use an ordered logistic regression since it is an ordinal variable, but the results were statistically insignificant (Table A2).
Income
Self-reported over-qualification has a modest, statistically significant negative relationship with earnings (p=0.020). A possible explanation is that workers who are over-qualified are working in lower-paid positions and industries that do not make full use of their skills—based on the industry findings discussed below.
Controlling for age group, gender, highest level of education attained and whether they were born in Canada, workers who report being over-qualified fall about one-quarter of a decile lower on the ten-point monthly earnings decile scale than otherwise similar workers who do not report being over-qualified.
Life Satisfaction
People who consider themselves as over-qualified for their job report lower life satisfaction. They are slightly more likely than well-matched workers to choose a 6 or 7 out of 10 and less likely to choose an 8, 9, or 10 out of 10.
In our regression analysis, we find a modest, statistically significant negative relationship between self-reported over-qualification and life satisfaction (p<0.001). Workers who self-report being over-qualified for their job score one-third of a point lower in life-satisfaction than workers whose skills are well-matched. One explanation is that workers who are over-qualified might be more likely to be less satisfied with their jobs than well-matched workers, and therefore more likely to report lower satisfaction with their lives more broadly.
The relationship between industry-level over-qualification and productivity
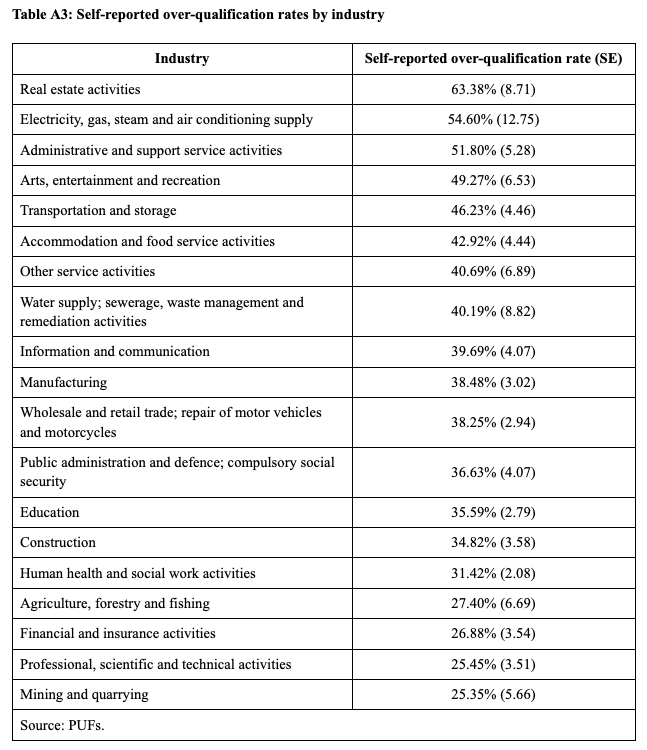
Self-reported over-qualification varies substantially by industry, ranging from 25.4% in the mining and quarrying sector to 63.4% in the real estate sector (Table A3).
It is possible that certain industries might have higher rates of over-qualification because they tend to have lower entry requirements and would therefore be more prone to education-industry mismatch. For example, it is not uncommon to see recent university graduates working in industries like accommodation and food service activities until they land a job in the fields they have studied for. However, to properly assess this hypothesis it would be necessary to look further into respondents’ fields of study.
We then test the correlation between over-qualification and industry-level labour productivity.
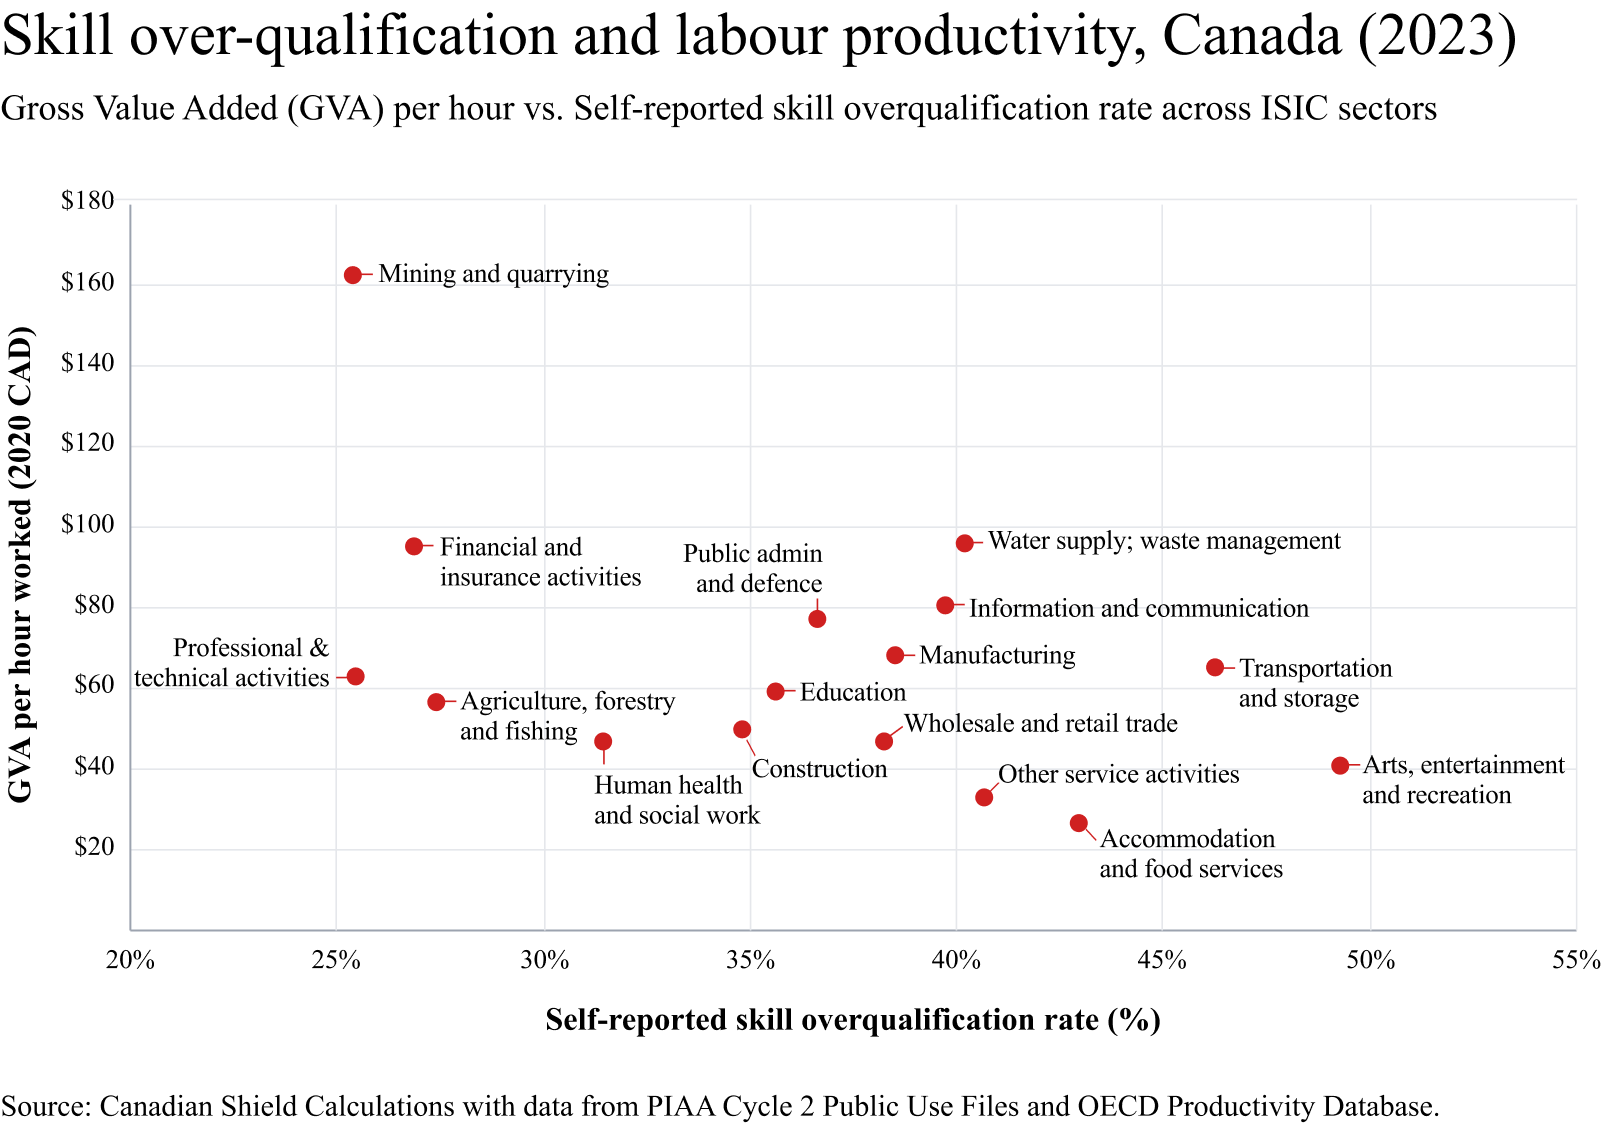
We find that there is a weak negative correlation between self-reported over-qualification and industry-level productivity rates (see Table A4 in the Appendix for a note on the treatment of outliers and cases where data was not available).
It is difficult to assess whether there is any causal relationship here, as there may be confounding variables at play that affect both an industry’s productivity and self-reported over-qualification rate, such as entry requirements or average educational attainment. More study is needed to draw any conclusions.
Socio-demographic and jurisdictional factors
Older workers are often characterized as lacking the skills needed for a changing economy, while younger workers are often described as struggling to break into the jobs they want because they lack the right experience or training. Similar narratives run through other groups: immigrants are said to be more likely to be over-qualified for their jobs, or more education should reliably translate into a better job match. As we look at demographic factors for self-reported over-qualification, we also need to be aware that perceived levels of skill may be rooted in social factors.
Age
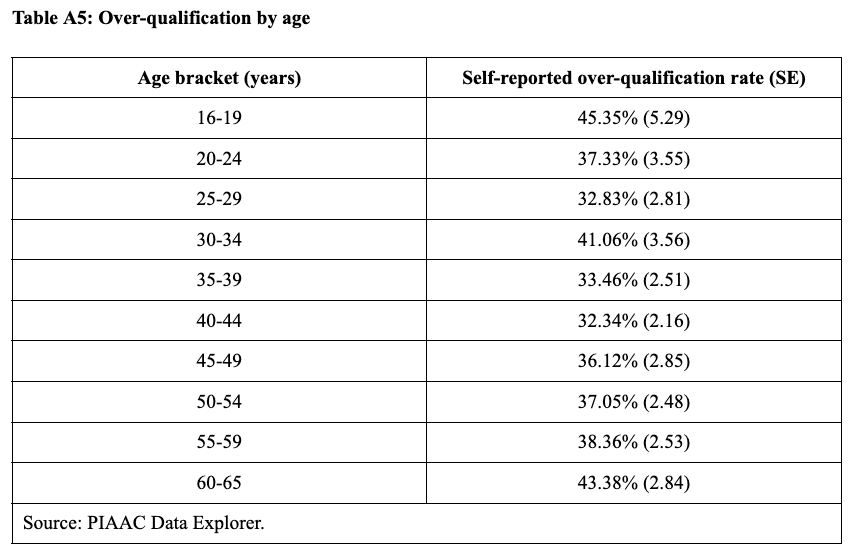
Over-qualification varies by about 10 percentage points according to age (Table A5).
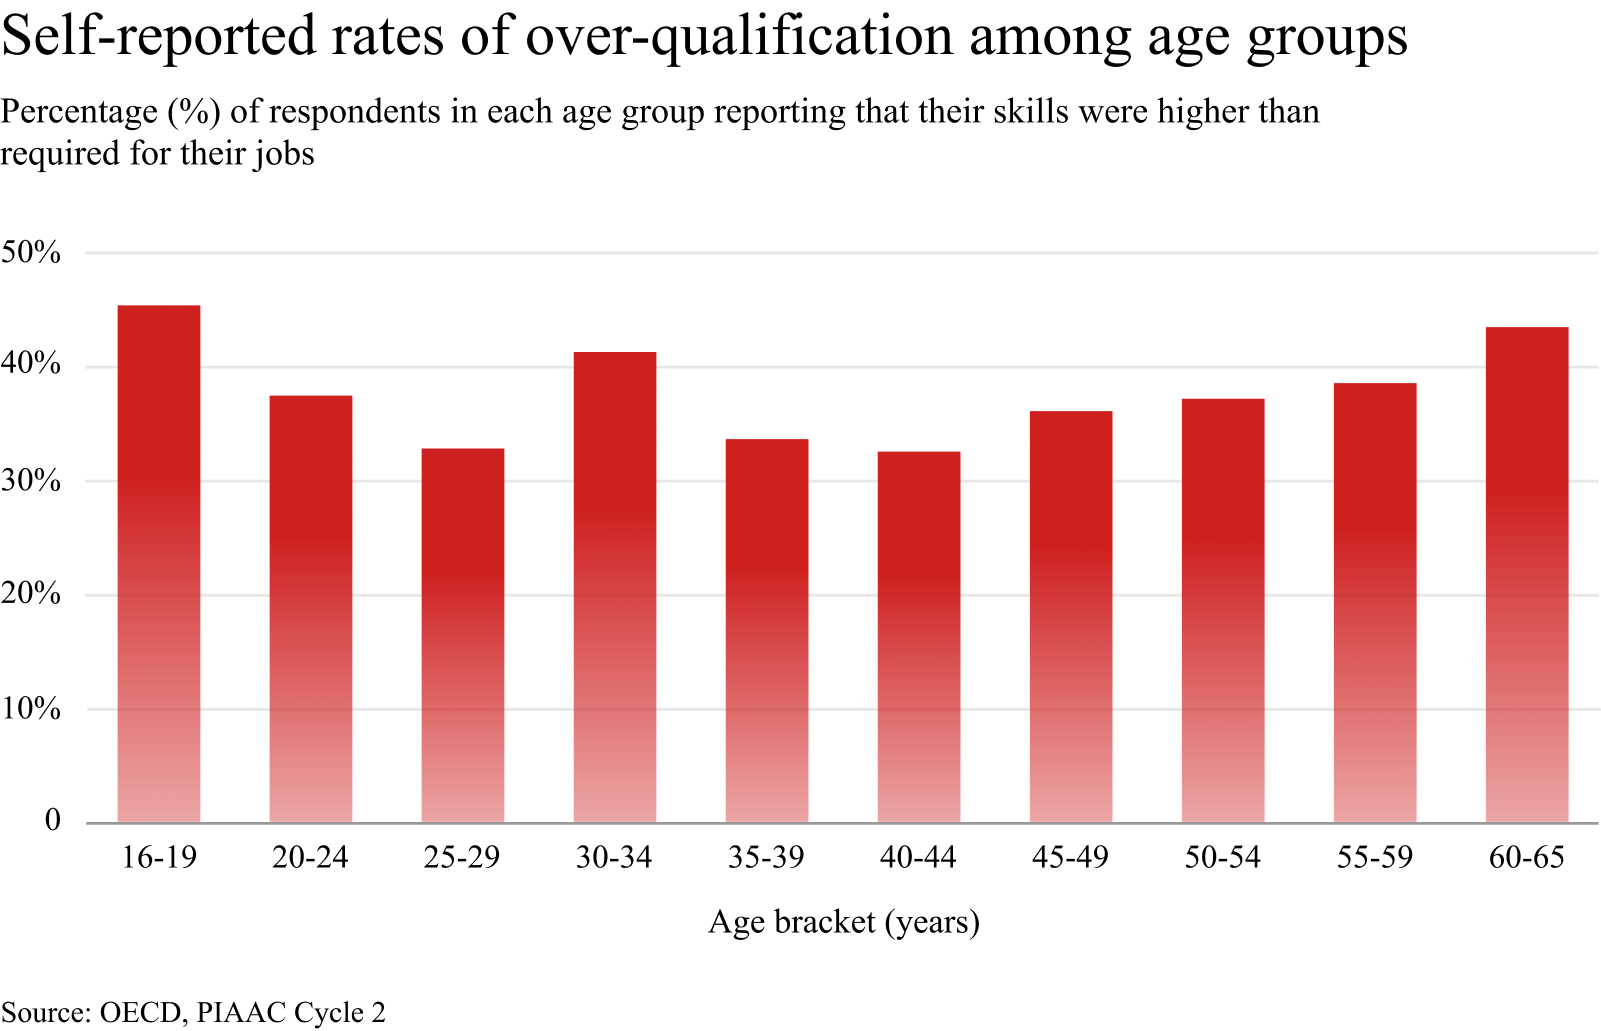
We observe the highest rates of over-qualification among workers between 16 and 19 years old, and then again among those between 60 and 65 years old. The rate of over-qualification dips between these age brackets, with a spike for workers between 30 and 34 years of age.
We hypothesize that the high rate of self-reported over-qualification among older workers could reflect that these workers tend to have high levels of experience for the jobs they currently hold. Among the youngest workers, it might simply reflect that these workers are early in their careers, and more likely to occupy jobs that do not yet fully use their skills. For those between the ages of 30 to 34, the slight spike in over-qualification might indicate that these workers are more likely to feel ready for promotions or for new opportunities that use the experience they have gained—though this is only one plausible explanation.
Gender
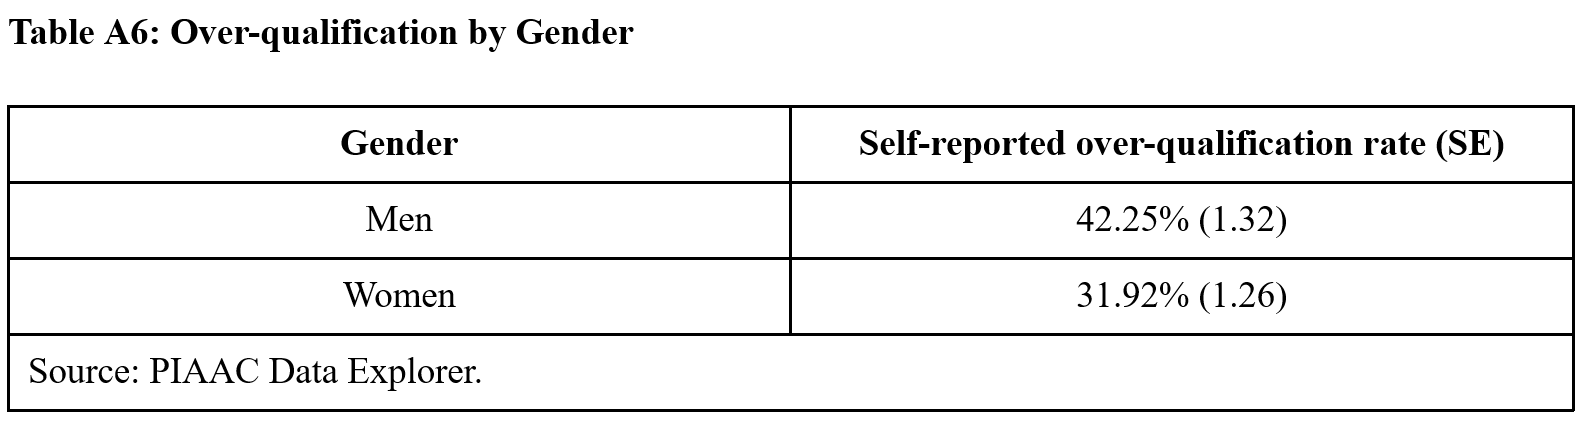
We find that men (42.25%) are more likely to self-report being over-qualified for their current job than women (31.92%). The gap is more than 10 percentage points (Table A6). This is an area where we need to consider that gender is a factor that may lead to different tendencies in self-reporting.
Indeed, looking at a measure of over-education—which we constructed for supplementary analysis—we see that men and women are over-educated for their jobs at virtually the same rate. This measure looks at the mean level of education possessed among a group, compared to the mean level required by a job (see Table A12 for a full breakdown of the methodology and findings).
Place of birth
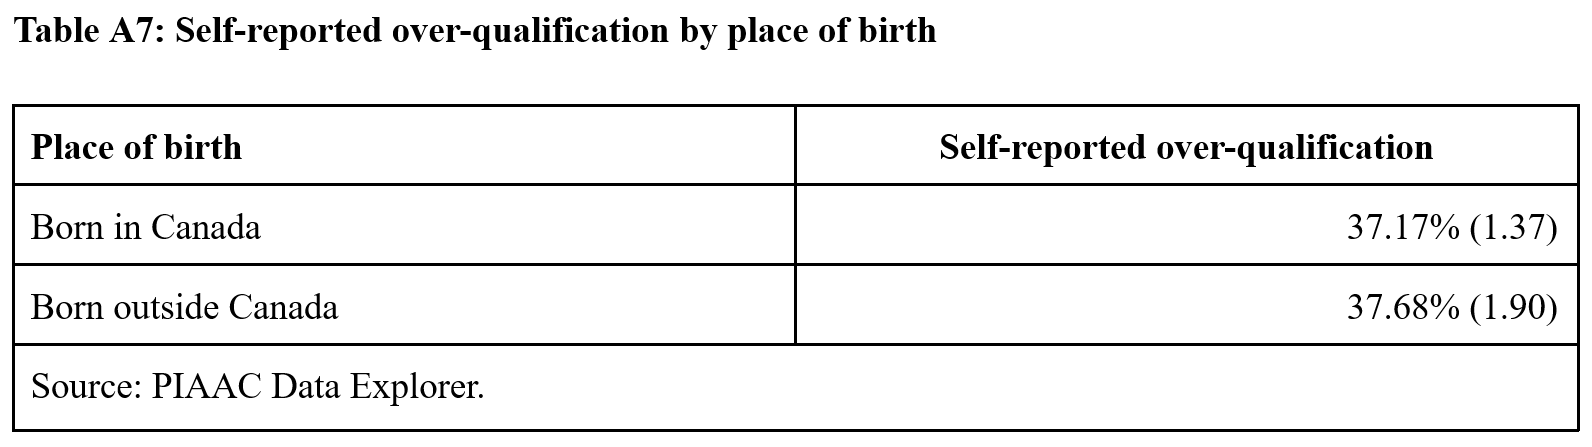
Among both Canadian-born workers and foreign-born workers, we see a self-reported over-qualification rate of around 37% (Table A7). However, again looking at our measure of over-education, we see higher levels of education achieved, relative to the respondent’s current job, among foreign-born workers and a narrower gap between education and current job for Canadian-born workers. Foreign-born workers are also over-educated at a higher rate than Canadian-born ones (Table A12).
There are multiple potential explanations for what’s happening here. It could be that immigrants are less likely to report being over-qualified because they discount their own skills and education. It could also be that Canadian employers place a premium on Canadian experience, while undervaluing foreign credentials.
Another factor worth considering is that the PIAAC data only measures whether a worker says that they are over-qualified, but it does not measure the degree to which they are over-qualified. A person with an undergraduate degree in journalism working at a fast food restaurant will feel over-qualified, but if the fry cook has a PhD in comparative literature, they will also report being over-qualified. Our self-reported measure of over-qualification will classify these two workers the same.
Education
We compared the self-reported over-qualification rate across levels of education using the International Standard Classification of Education (ISCED) levels coded in the PIAAC data.
Over-qualification rates vary relatively little between levels of education (Table A8). There are two outliers from this pattern:
- People who have a post-secondary, non-tertiary education, like a trade certificate, are most likely to report being over-qualified for their current job at 41.5% and
- Workers with a master’s degree or PhD are least likely to report being over-qualified for their current role at 29.7%.
We were not expecting to see low rates of over-qualification in the highest-educated workers; we expected that more education would lead to individuals who feel that their full suite of skills was not being adequately utilized in the working world. However, the data points to the reality that individuals can spend years of their life, and tens of thousands of dollars on higher degrees, and still nearly 3 in 10 feel they cannot find employment that harnesses their true ability in Canada.
It is worth noting the limits of looking at educational attainment, in relation to over-qualification. Looking at somebody’s highest level of education does not measure the amount of experience that a person has at the job they currently hold or the skills they have developed across their career.
We observed that workers with a high school education report similar rates of over-qualification to people with higher levels of education. On the one hand, you might expect people with more education and skills to have more potential to be over-qualified for their job. On the other hand, a worker with only high school could still have experience and skills that employers fail to recognize, because that kind of skills development does not come with a credential.
The labour market is a land of contrasts.
Jurisdiction
The magnitude of self-reported over-qualification varies by province from a low of just under 29% in Quebec to a high of 44% in Ontario (Table A9). Alberta’s rate of over-qualification is nearly as high as Ontario’s. The data cannot tell us very much about why this is the case.
The role of training
Training appears to be associated with lower over-qualification when employers bear at least some of the cost—either financially or through paid time.
In the PIAAC Cycle 2 survey, respondents were asked whether they had taken training in the last year; of those people who had participated in training, 54.61% said that their employer paid for at least some of the costs. On the other hand, 45.39% said they had training in the last year to which their employer did not contribute any financing.
Among those people who had the employer pay for at least some of the costs of training, 33% said that they felt over-qualified in their current job. By comparison, among workers who did not get any financial support from their employer, 39% said they feel over-qualified in their role (Table A10).
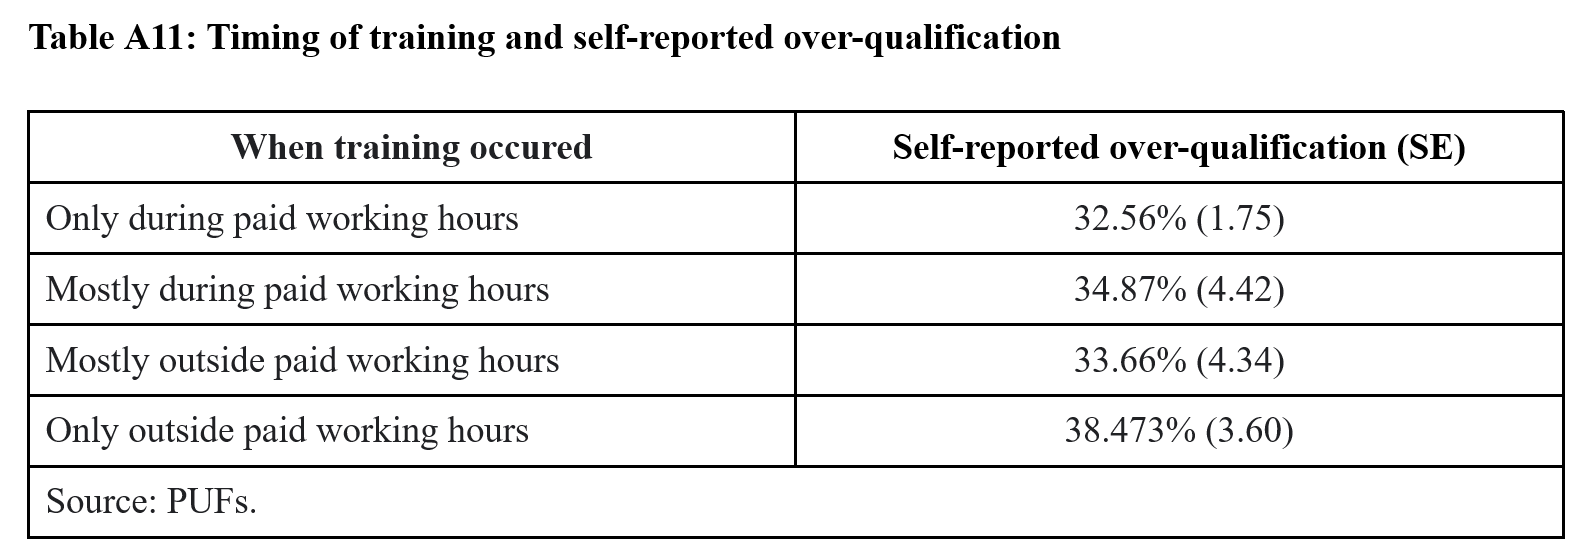
A similar pattern emerges based on the timing of training. Workers who trained only during paid working hours report the lowest over-qualification rate, at 33%, while those who trained only outside paid working hours report the highest at 38% (Table A11).
This makes a certain amount of intuitive sense: Training done at an employer’s direction within the workplace is likely to be more closely tied to actual job requirements, and the employer will have the best understanding of the type of training workers actually need. Employers bearing the cost of the training—either by paying directly, or by using work hours for training—will have a clear incentive to ensure that skill development leads directly to skill use.
To further test this relationship, we ran a regression to determine the association of employer-financed training relative to the likelihood of a respondent self-reporting that their skills were higher than required for their job, controlling for age group, gender, educational attainment and place of birth. Both the dependent and independent variables are binary, so we use a binary logistic regression.
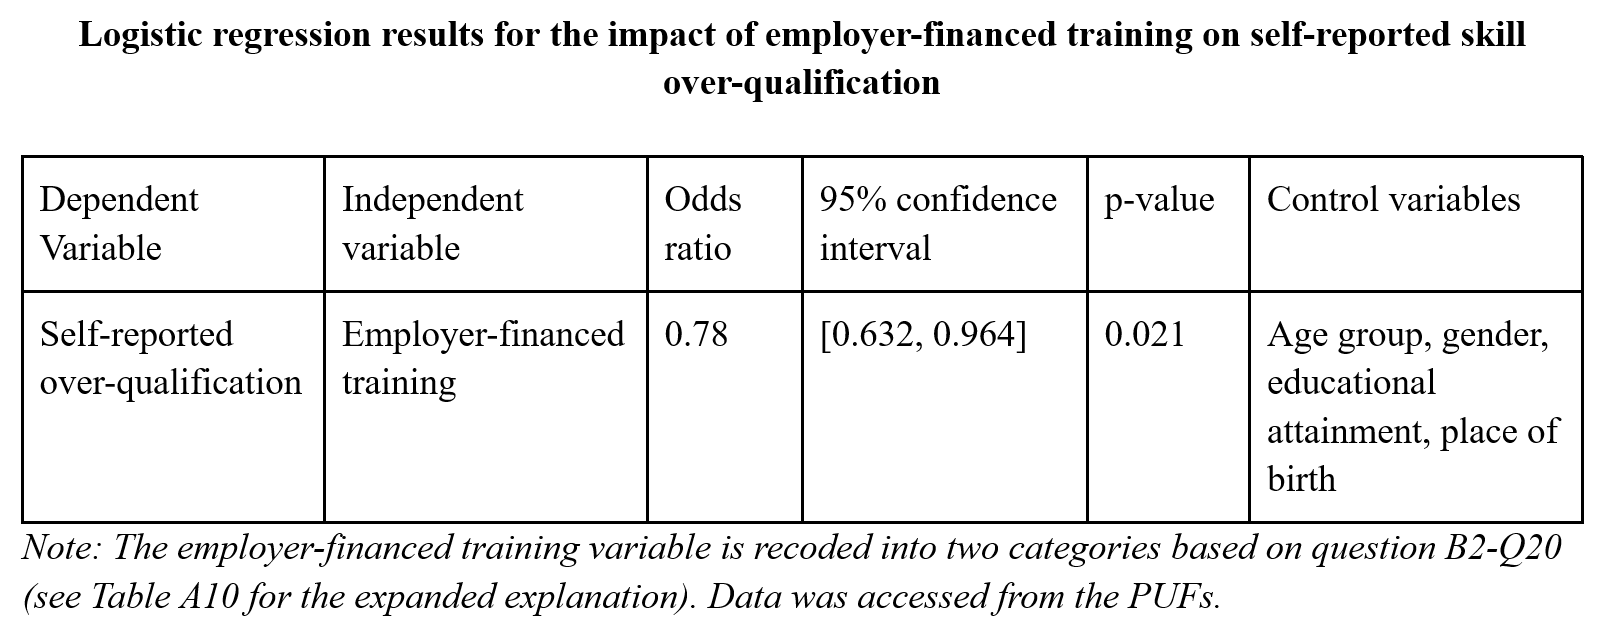
We find that, accounting for age group, gender, educational attainment and place of birth, workers whose training was at least partly financed by their employer had 22% lower odds of reporting that their skills were higher than required for their jobs than workers whose training was not financed by their employers.
Employer-financed training might also be a promising pathway for ensuring that the skills developed in training are actually being used as drivers of both economic and individual prosperity, but further research is needed to answer this question.
Job demand is shifting; workers are stuck in the gaps
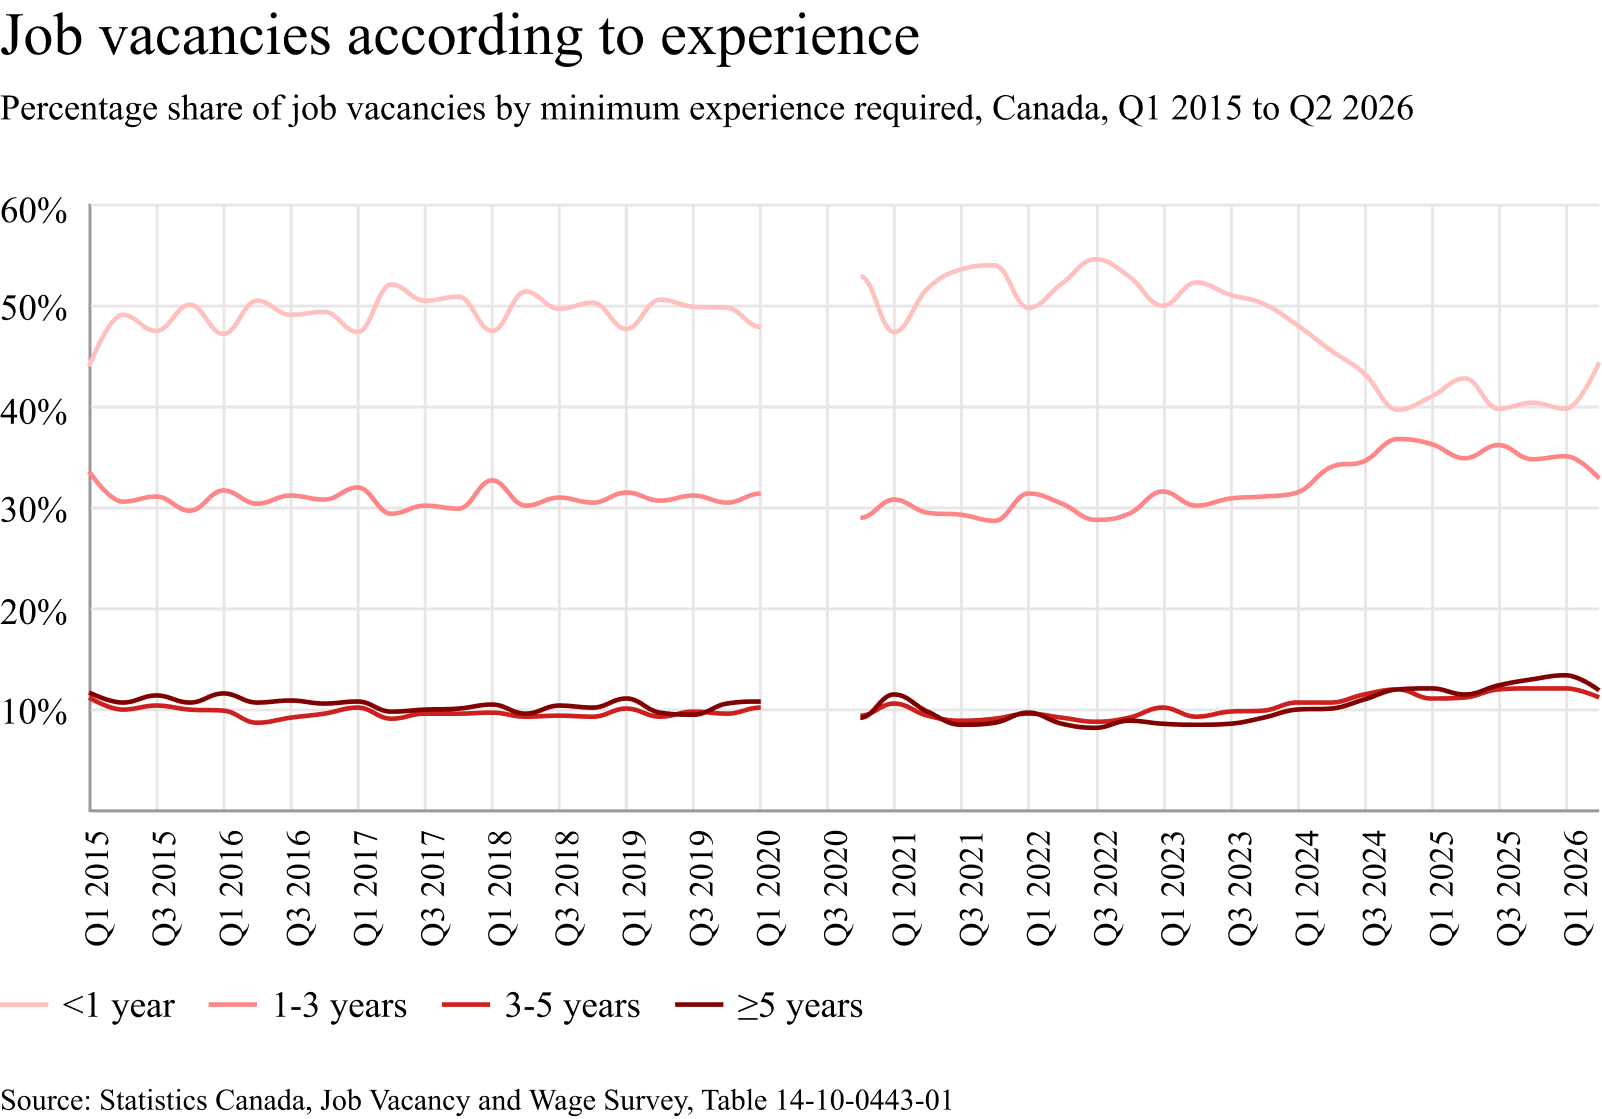
There is evidence that entry-level jobs are eroding.
Statistics Canada’s Job Vacancy and Wage Survey shows that the share of job vacancies requiring less than one year of experience is declining, dropping from about 50% in the five years before the pandemic to 40% in Q1 2026.
This tracks with Statistics Canada data that shows that recent graduates are more likely to be unemployed than the average of the population overall. Thirty years ago, if you were a young person with a university degree, you were more likely to have a job than older workers. The trend over time has been that young people with a degree have seen their rates of employment fall steadily—which goes hand in hand with the erosion of entry-level jobs.
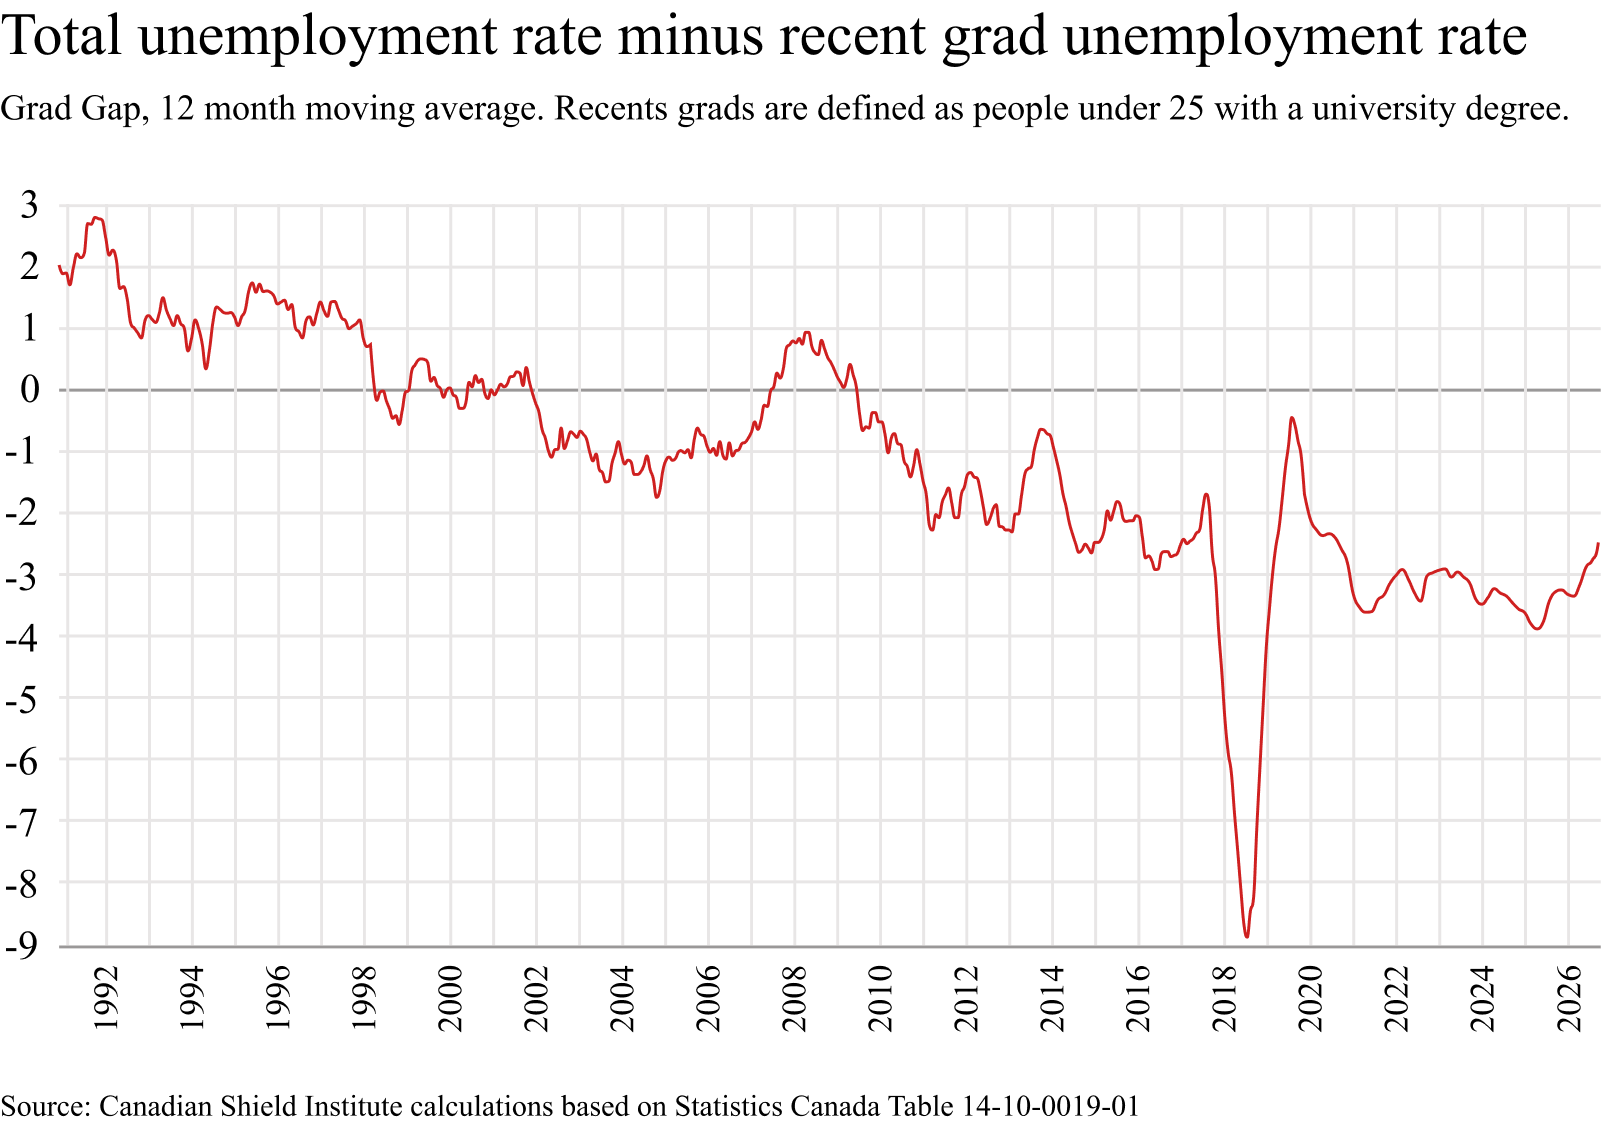
Our analysis of over-qualification has so only looked at employed workers, but looking at the unemployment data in tandem data also gestures at a problem of skill utilization. At the most fundamental level, if a significant proportion of young, recent graduates are unable to find work—let alone work that makes full use of their skills—their skills are not being used as drivers of economic or individual prosperity. This is an area that further research could seek to illuminate.
Implications and Future Directions
There’s no doubt that Canada has a skills mismatch. In recent years, the policy conversation has treated this primarily as a supply-side problem. Workers are encouraged to upgrade their skills, get more education, take more microcredentials. But as we have seen, educational attainment is an imperfect measure of job fitness. The self-reported over-qualification rate shines a light on this reality.
Future Directions
The next wave of the PIAAC survey should include questions on what skills respondents are thinking of when they answer that their skills are higher than what is required for their job. The Cycle 2 Survey only asked that question of people who thought their skills were lower than what is required.
It would be useful to understand the types of aptitude and capability testing people may be participating in at work. A question on testing could be added to the next round of the PIAAC survey or the Future Skills Centre could invest in a survey to discover what industries or types of workplaces are starting to use skills-identifying techniques in order to utilize the skills of their workforce.
Some over-qualification may be transitory: new graduates and recent immigrants entering the labour market, or more senior workers that may be changing careers. But some over-qualification may be chronic, with workers persistently stuck in jobs that fail to utilize their full potential. Future work should distinguish short-term dislocation from long term underuse.
Quebec’s notably lower over-qualification rate and Ontario’s and Alberta’s much higher rates raise some important questions. More research is needed to determine whether these differences may be the result of different policy systems. Are they driven by differences in jobs, credential recognition, labour market institutions, employment programs, or educational initiatives?
Our analysis was also limited because the data captures the prevalence of self-reported over-qualification but the survey does not capture magnitude. The PIAAC data tells us whether workers believe their skills are higher than their job required, but not how much higher. It is possible that our analysis of over-qualification across different demographic groups, industries, and provinces misses key variations in the severity of instances of over-qualification.
Policy Directions
- Incentivize firms to provide employer paid training programs. Workers who participated in mostly employer-financed training, and during their paid working hours, reported the lowest levels of over-qualification. This suggests that employer-led training might target skills-development which is most closely aligned with actual workplace needs.
- Quebec offers one useful idea for a policy model. The Quebec Act to promote workforce skills development and recognition requires employers above a payroll threshold to invest 1% of payroll in workforce training initiatives. Since it was enacted, it has had a substantial, positive effect on the likelihood of employers in Quebec offering training—though gauging its true effectiveness is difficult with the available data.
- More broadly, Canadian governments may want to examine the effectiveness of existing skills development programs, and recalibrate their structure to allow employers to access funding for worker training that is directly tied to identified needs.
- Statistics Canada should conduct a comprehensive survey of skills utilization and matches in Canada. This would look beyond simply education-job mismatch and employers’ perspectives on the skills of workers to assess why Canadians feel over-qualified, in what fields and how much. Regularly measuring skill utilization in a standardized way, beyond the self-reported measure in the PIAAC survey, would provide much more robust data for analysis and for designing policy interventions. Future cycles of PIAAC could similarly enhance the self-reported measure by considering which skills workers report being over-qualified in, and to what degree.
- Ultimately, further research is needed to assess:
- If and why there are differences in over-qualification across provinces and territories, and why Canada’s over-qualification rate tends to be higher than peer countries;
- If there is a correlation between over-qualification and productivity, and over-qualification and life satisfaction; and
- The influence of demand-side factors on skill and educational over-qualification, including whether we are seeing a systematic lessening of demand for certain skills, looking at patterns over time.
Appendix: Supplementary Data Tables
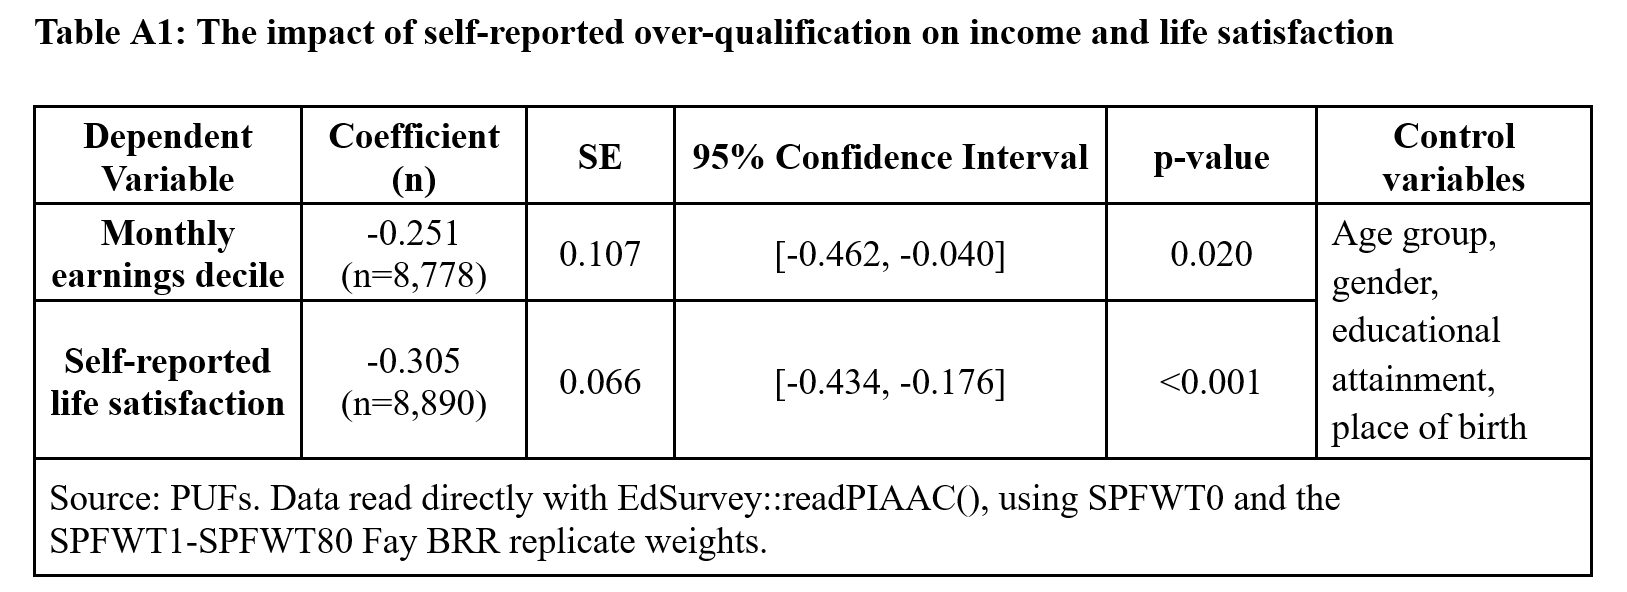
Methodology: Skill over-qualification is recoded inside lm.sdf from H2_Q19a; the comparison group is matched or lower skills. Monthly earnings decile uses EARNMTHALLDCLC2 coded 1 = lowest decile through 10 = highest decile. Life satisfaction uses I2_Q05 recoded inside lm.sdf coded 0 = Extremely dissatisfied, 10 = Extremely satisfied. Controls use AGEG5LFS for age group, GENDER_R for gender, EDCAT7_TC1 for highest education, and A2_Q03a_T for born/not born in country. Respondents missing any required control are dropped by subsetting the native EdSurvey object before modelling.
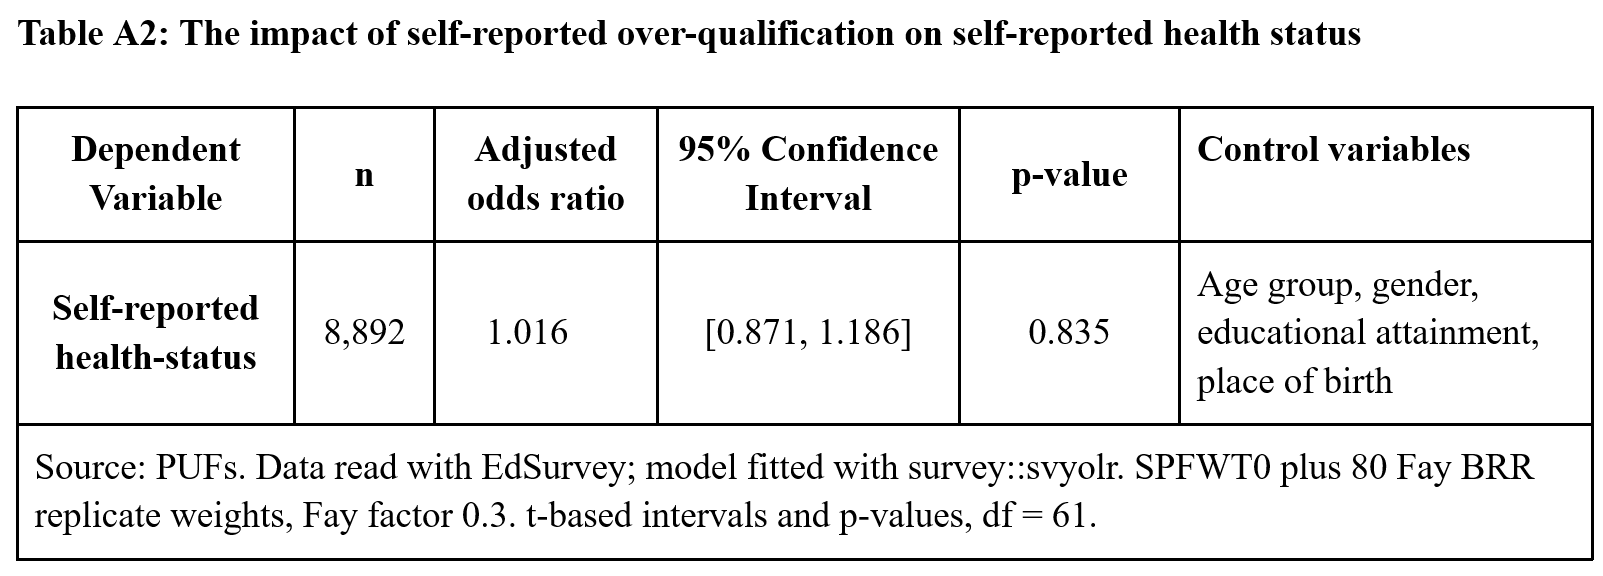
Methodology: Skill over-qualification and control variables use the same methodology as Table A1 above. Health status uses I2_Q03 (Order: Poor, Fair, Good, Very good, Excellent). Original codes reversed once using 6 minus the original code. All five categories were kept.
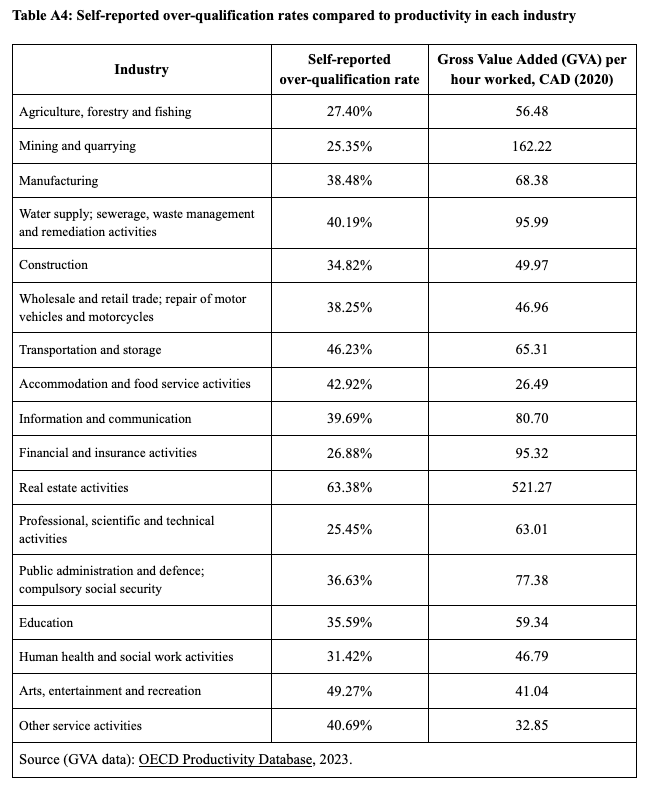
Note: Electricity and gas supply and administrative and support services were excluded because published productivity values were unavailable in the OECD data. Real estate was excluded because its productivity—approximately $521 per hour worked in 2020 Canadian dollars—was a substantial outlier that compressed the remaining observations on the chart’s linear scale. OECD categories without corresponding over-qualification rates within the PIAAC data were also omitted.
Note: Data for the Northwest Territories, Nunavut and Yukon was not available.
Note: This is a recoding of question B2_Q20, which asks respondents to check all applicable boxes for who financed the training that they participated in. Any respondent who selected the box indicating that their employer financed training were counted as participating in training that was at least partly financed by an employer. Respondents who checked any combination of boxes besides the one for their employer were counted as participating in training that was not employer-financed.
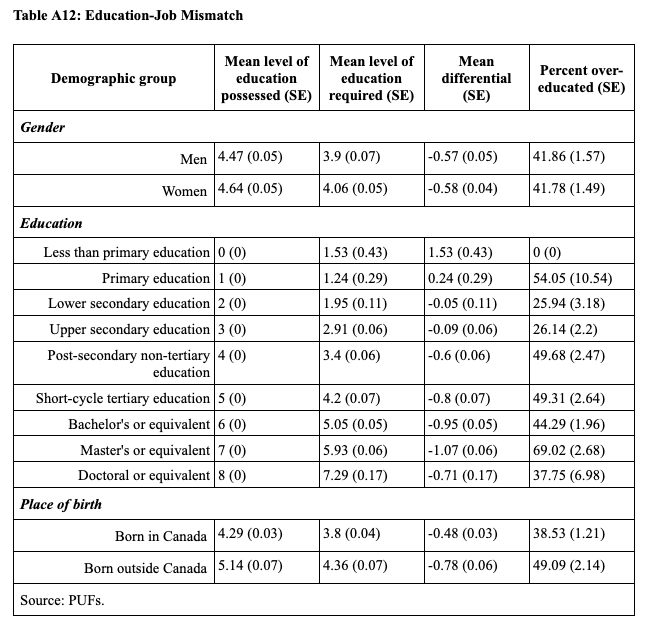
Methodology: The analysis uses Canadian PIAAC Cycle 2 public-use data and includes 7,777 employed respondents with valid education measures and positive survey weights. Educational attainment (EDA_ISCED1) is compared with the qualification respondents report would usually be needed to obtain their current type of job (EGC_ISCED1). Both variables use ISCED-A 2011 levels 0–8 to represent education. Respondents are classified as over-qualified, matched or underqualified according to whether their individual attained education exceeds, equals or falls below the reported requirement. So X% over-qualified means that X% of individuals within this demographic bracket possessed an education that was at least one ISCED level higher than what is required for their job.
Estimates use the final survey weight (SPFWT0), with standard errors calculated using 80 Fay BRR replicate weights and an adjustment factor of 0.3. Education-level gaps are interpreted as differences between ordinal categories.
Subscribe to